2020 Presidential Election Analysis
Kayla Manning, Harvard College
The Economy’s Role in Elections
September 19, 2020
Overview
While the research suggests that voters reward the incumbent party for short-term economic conditions,1 how does this vary among sitting presidents seeking re-election and same-party heirs seeking the office? The below plot indicates that the relationship between Q2 GDP Growth and two-party vote share does differ depending on incumbency status:
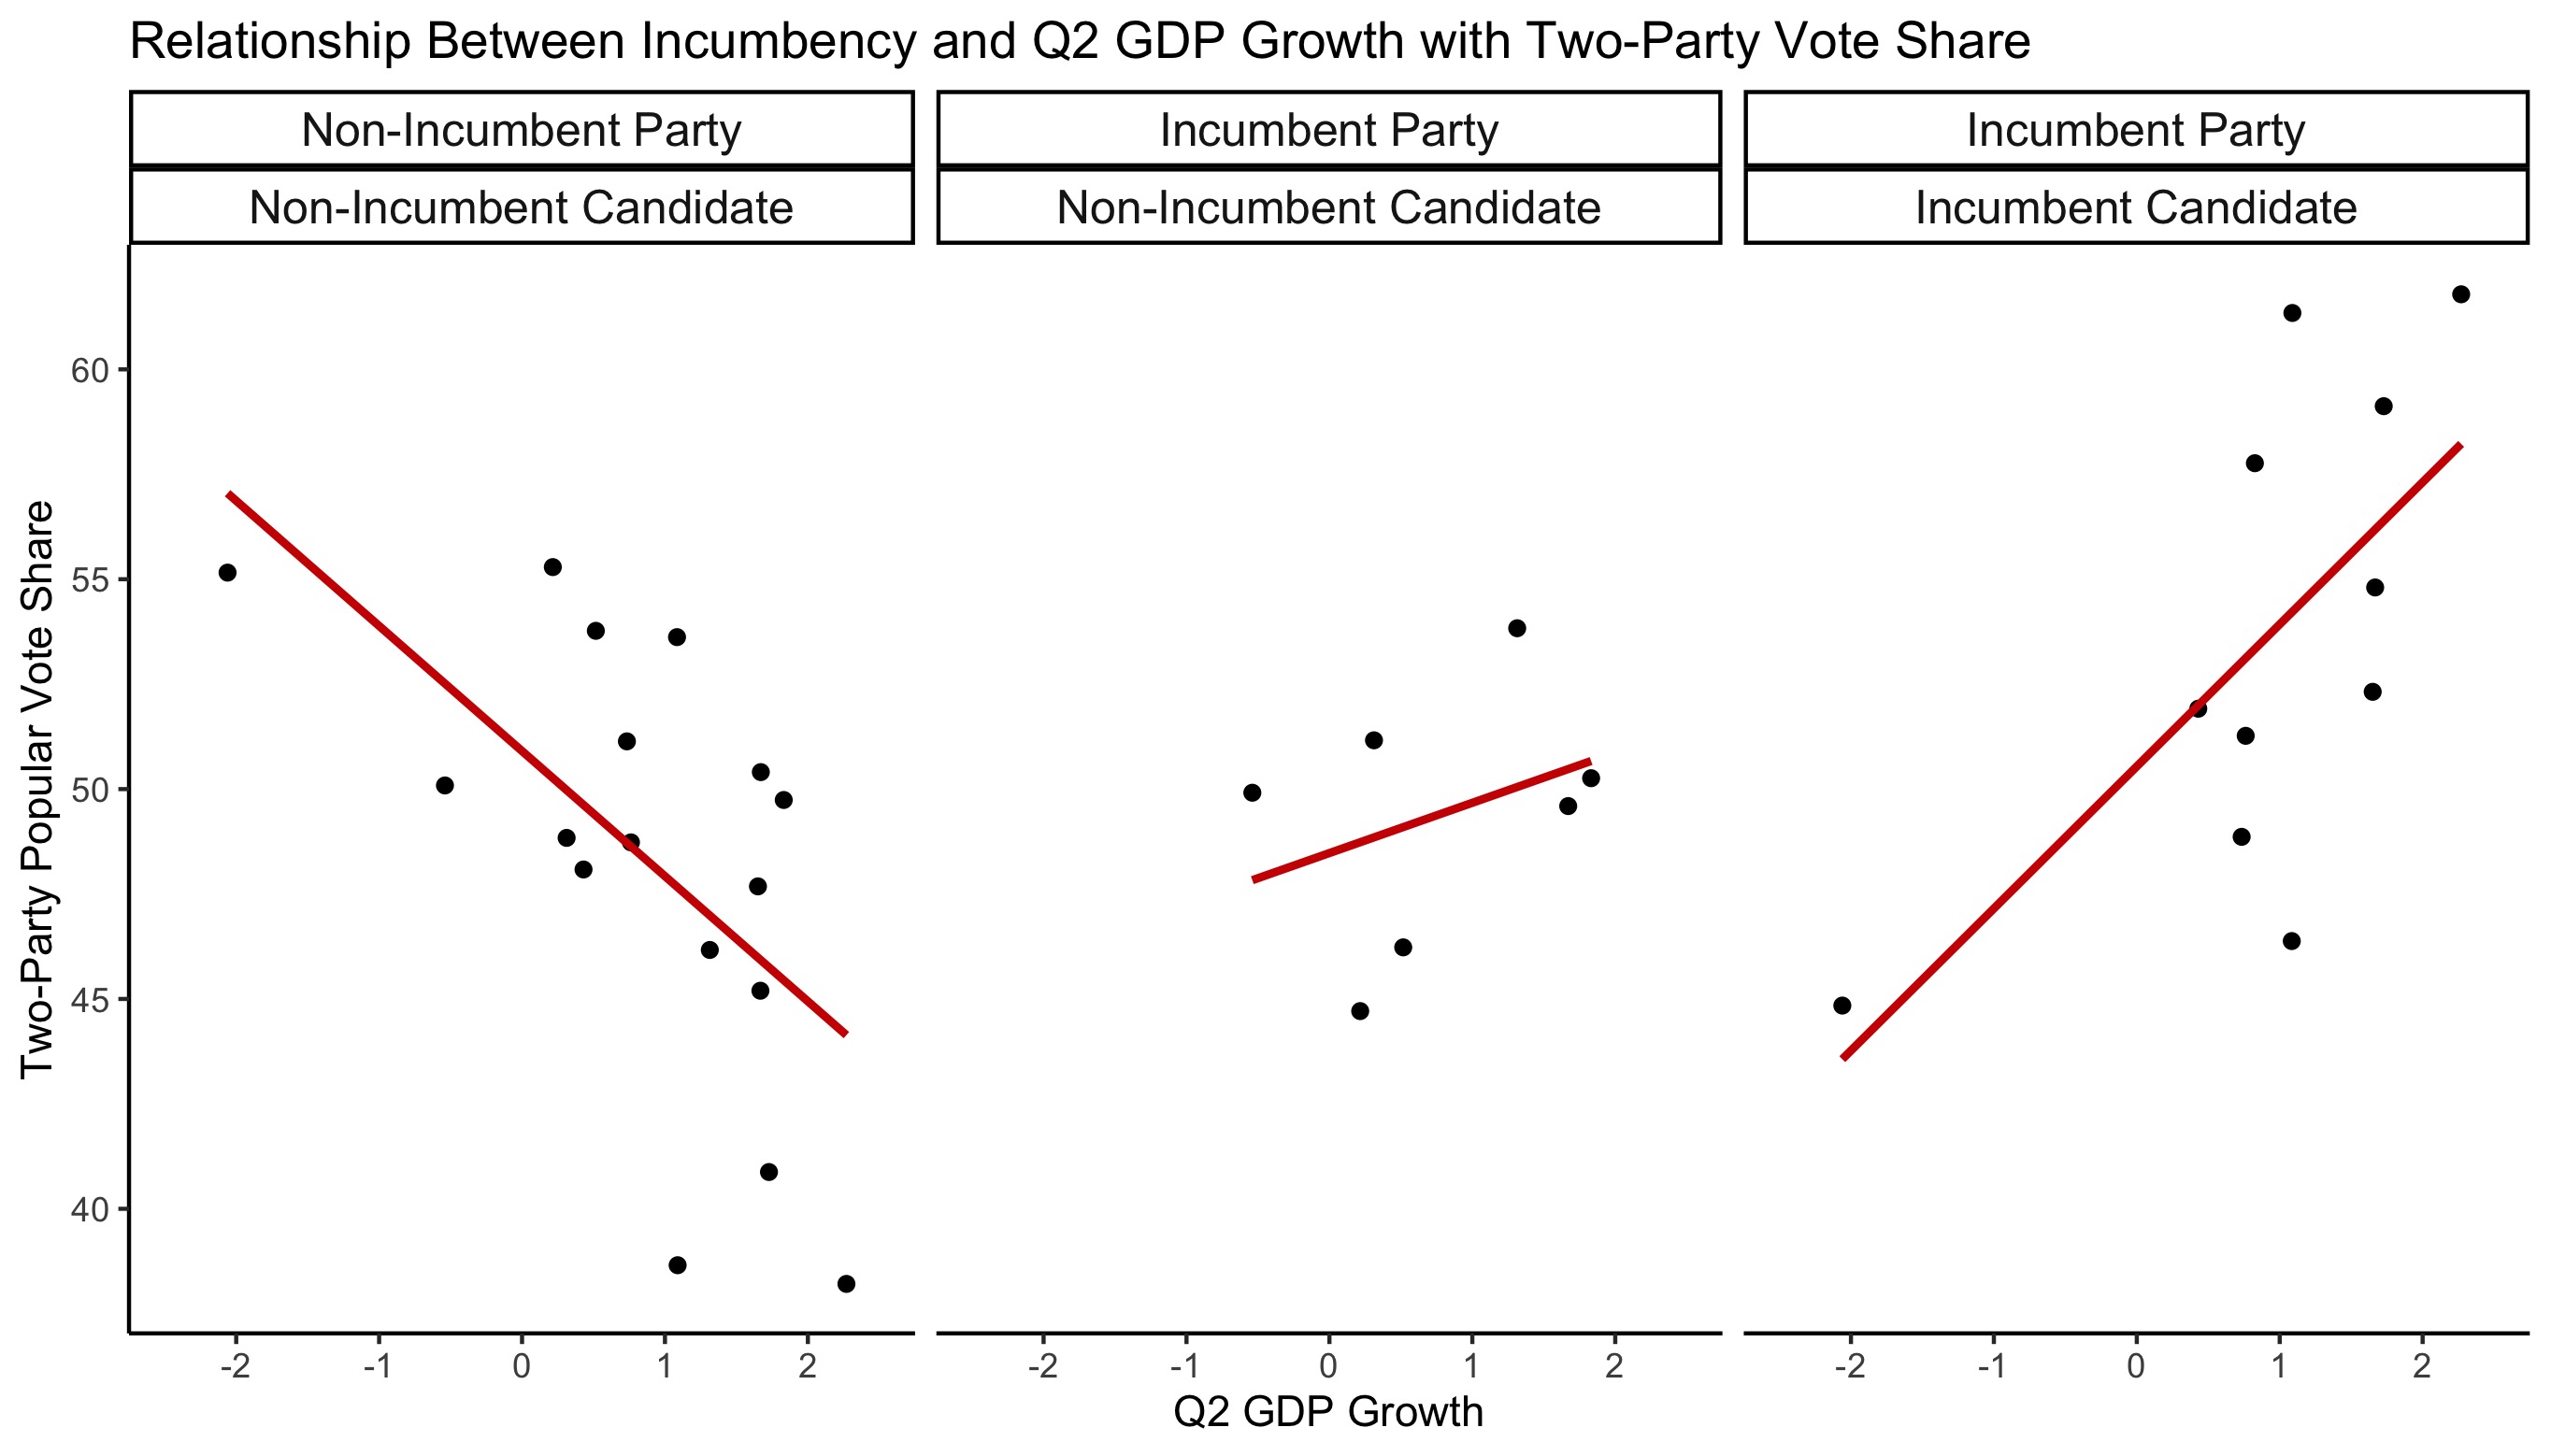
While recent economic conditions do not work in Donald Trump’s favor, I built three models that quantify the interaction of incumbency status with these economic conditions and predict Trump’s expected vote share based on economic indicators.
Model 1 : Incumbency Status and Q2 GDP Growth
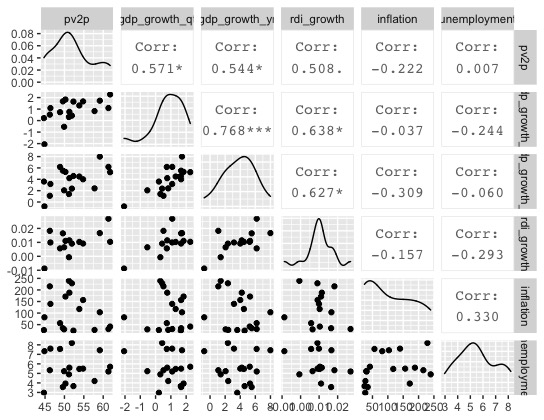
An exploratory analysis of the economic variables in the data2 revealed that Q2 GDP growth has the highest correlation with two-party vote share for the incumbent party. After testing the interaction between incumbency status with numerous variables, the strongest model examined the interaction between election-year Q2 GDP growth and incumbency status of candidates in the incumbent party. Since parsimonious models tend to predict the future better than more convoluted equations, I limited Model 1 to one economic variable with the intent to potentially add additional predictors in future models.
While the regression does not reveal a significant3 relationship between the interaction of incumbency status with GDP growth, it does detect that on average, an incumbent candidate’s two-party vote share increases by approximately 2.2 percentage points more than a non-incumbent candidate for every percentage increase in Q2 GDP growth.
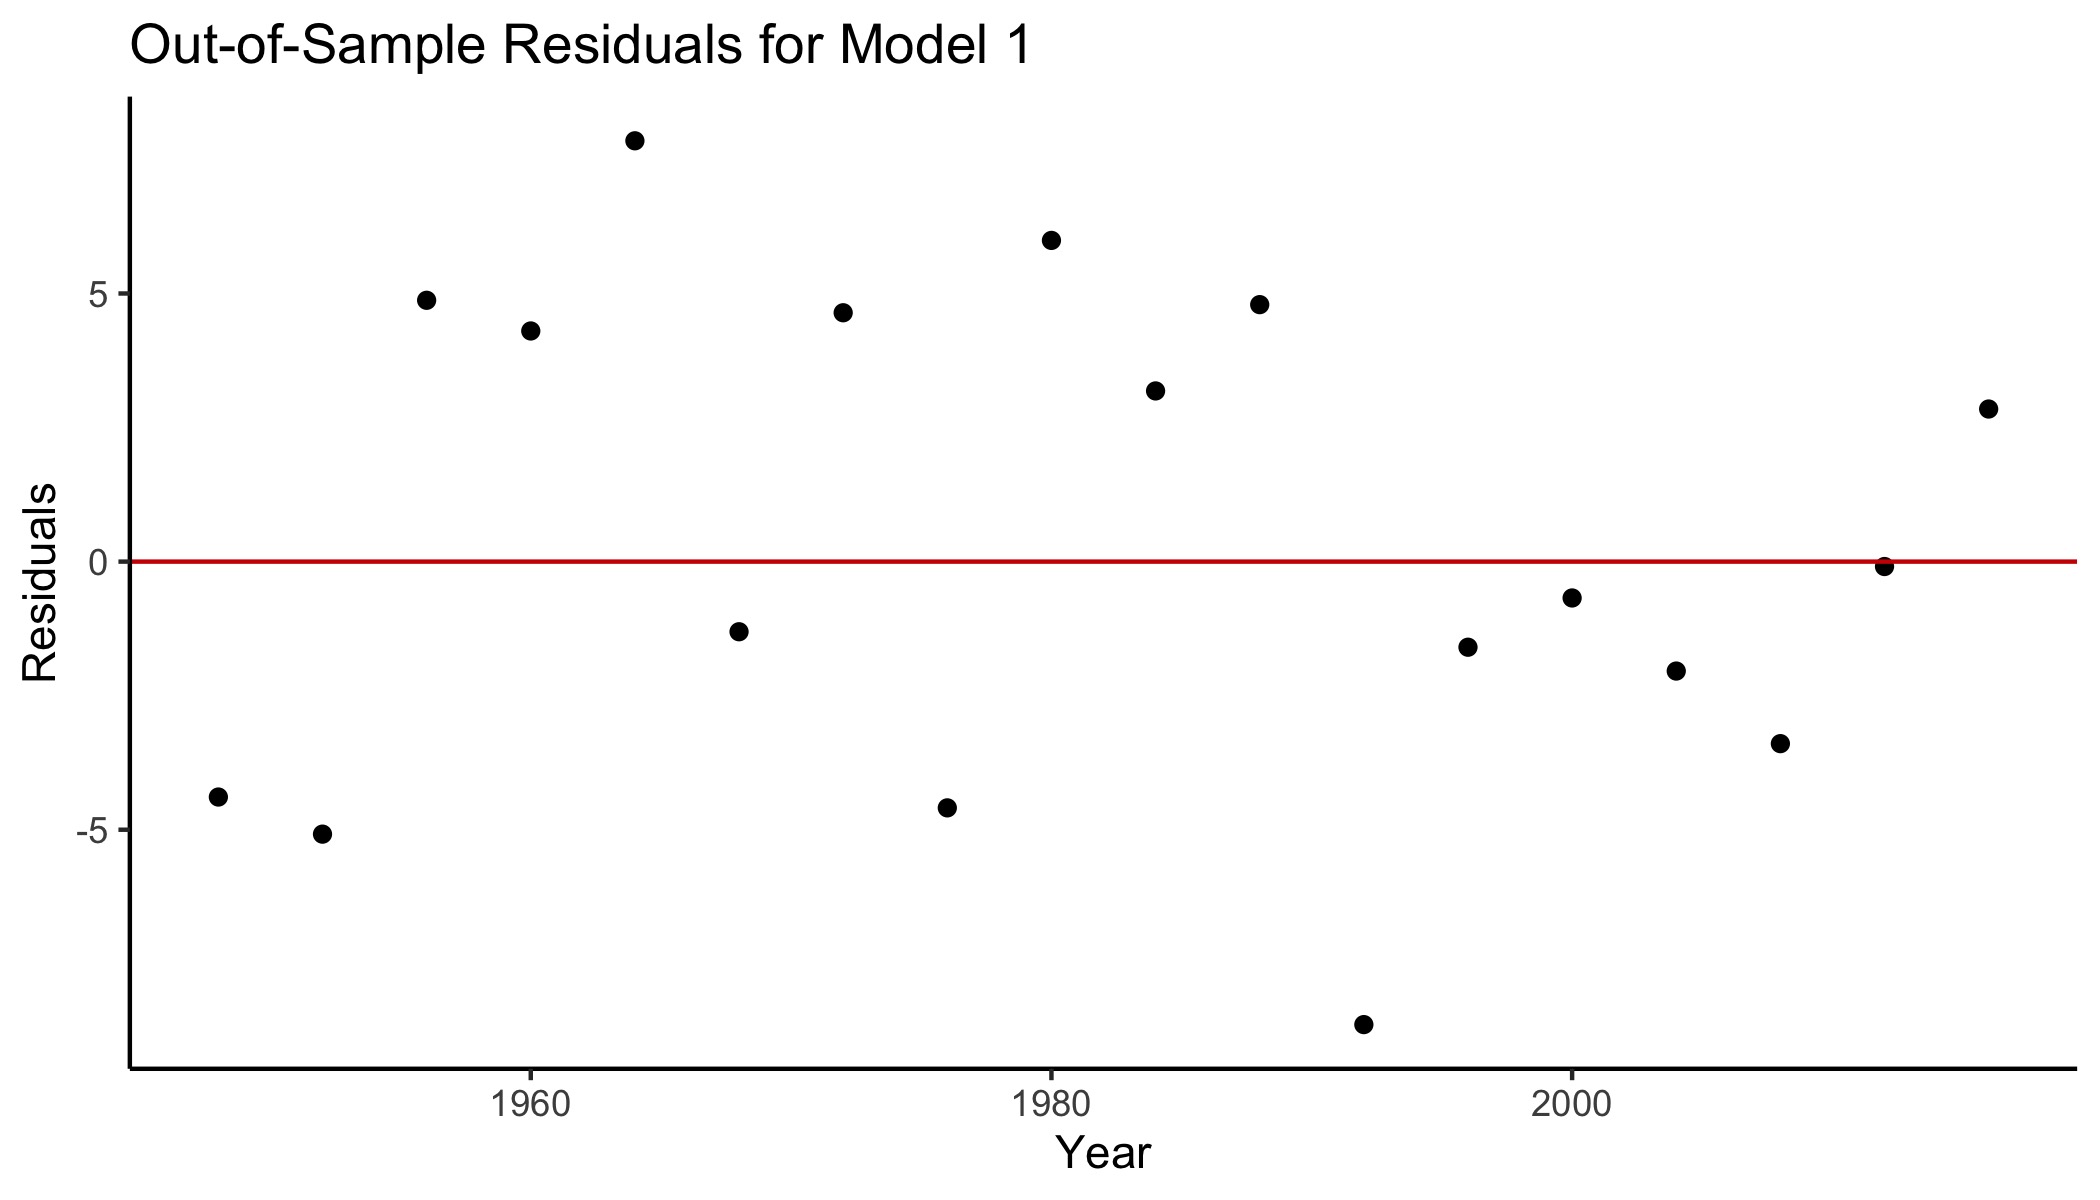
To test the out-of-sample fit for this model, I performed leave-one-out cross validation for each post-WWII election. A plot of the errors displays no clear pattern, and the model predicted most elections within 5 percentage points of the actual value.
After building the model and assessing the out-of-sample fit, I predicted Donald Trump’s predicted vote share using 2020 data. Q2 numbers typically serve as a good indicator for voting patterns in election years, but the COVID-19 pandemic brought historic lows for the US economy. Sure enough, this simple model predicted that he would only win approximately 18.4% of the popular vote.4
Model 2: Incumbency Status, Q2 GDP Growth, and Job Approval
While some people feel frustrated about Donald Trump’s performance, no one realistically expects him to only win 18% of the popular vote. Restricting the scope of a model to recent economic metrics gives undue weight to the economic disaster of 2020. However, incorporating long-term numbers weakens the in-sample strength of the model since short-term numbers have a much stronger association with the two-party popular vote share of the incumbent party.
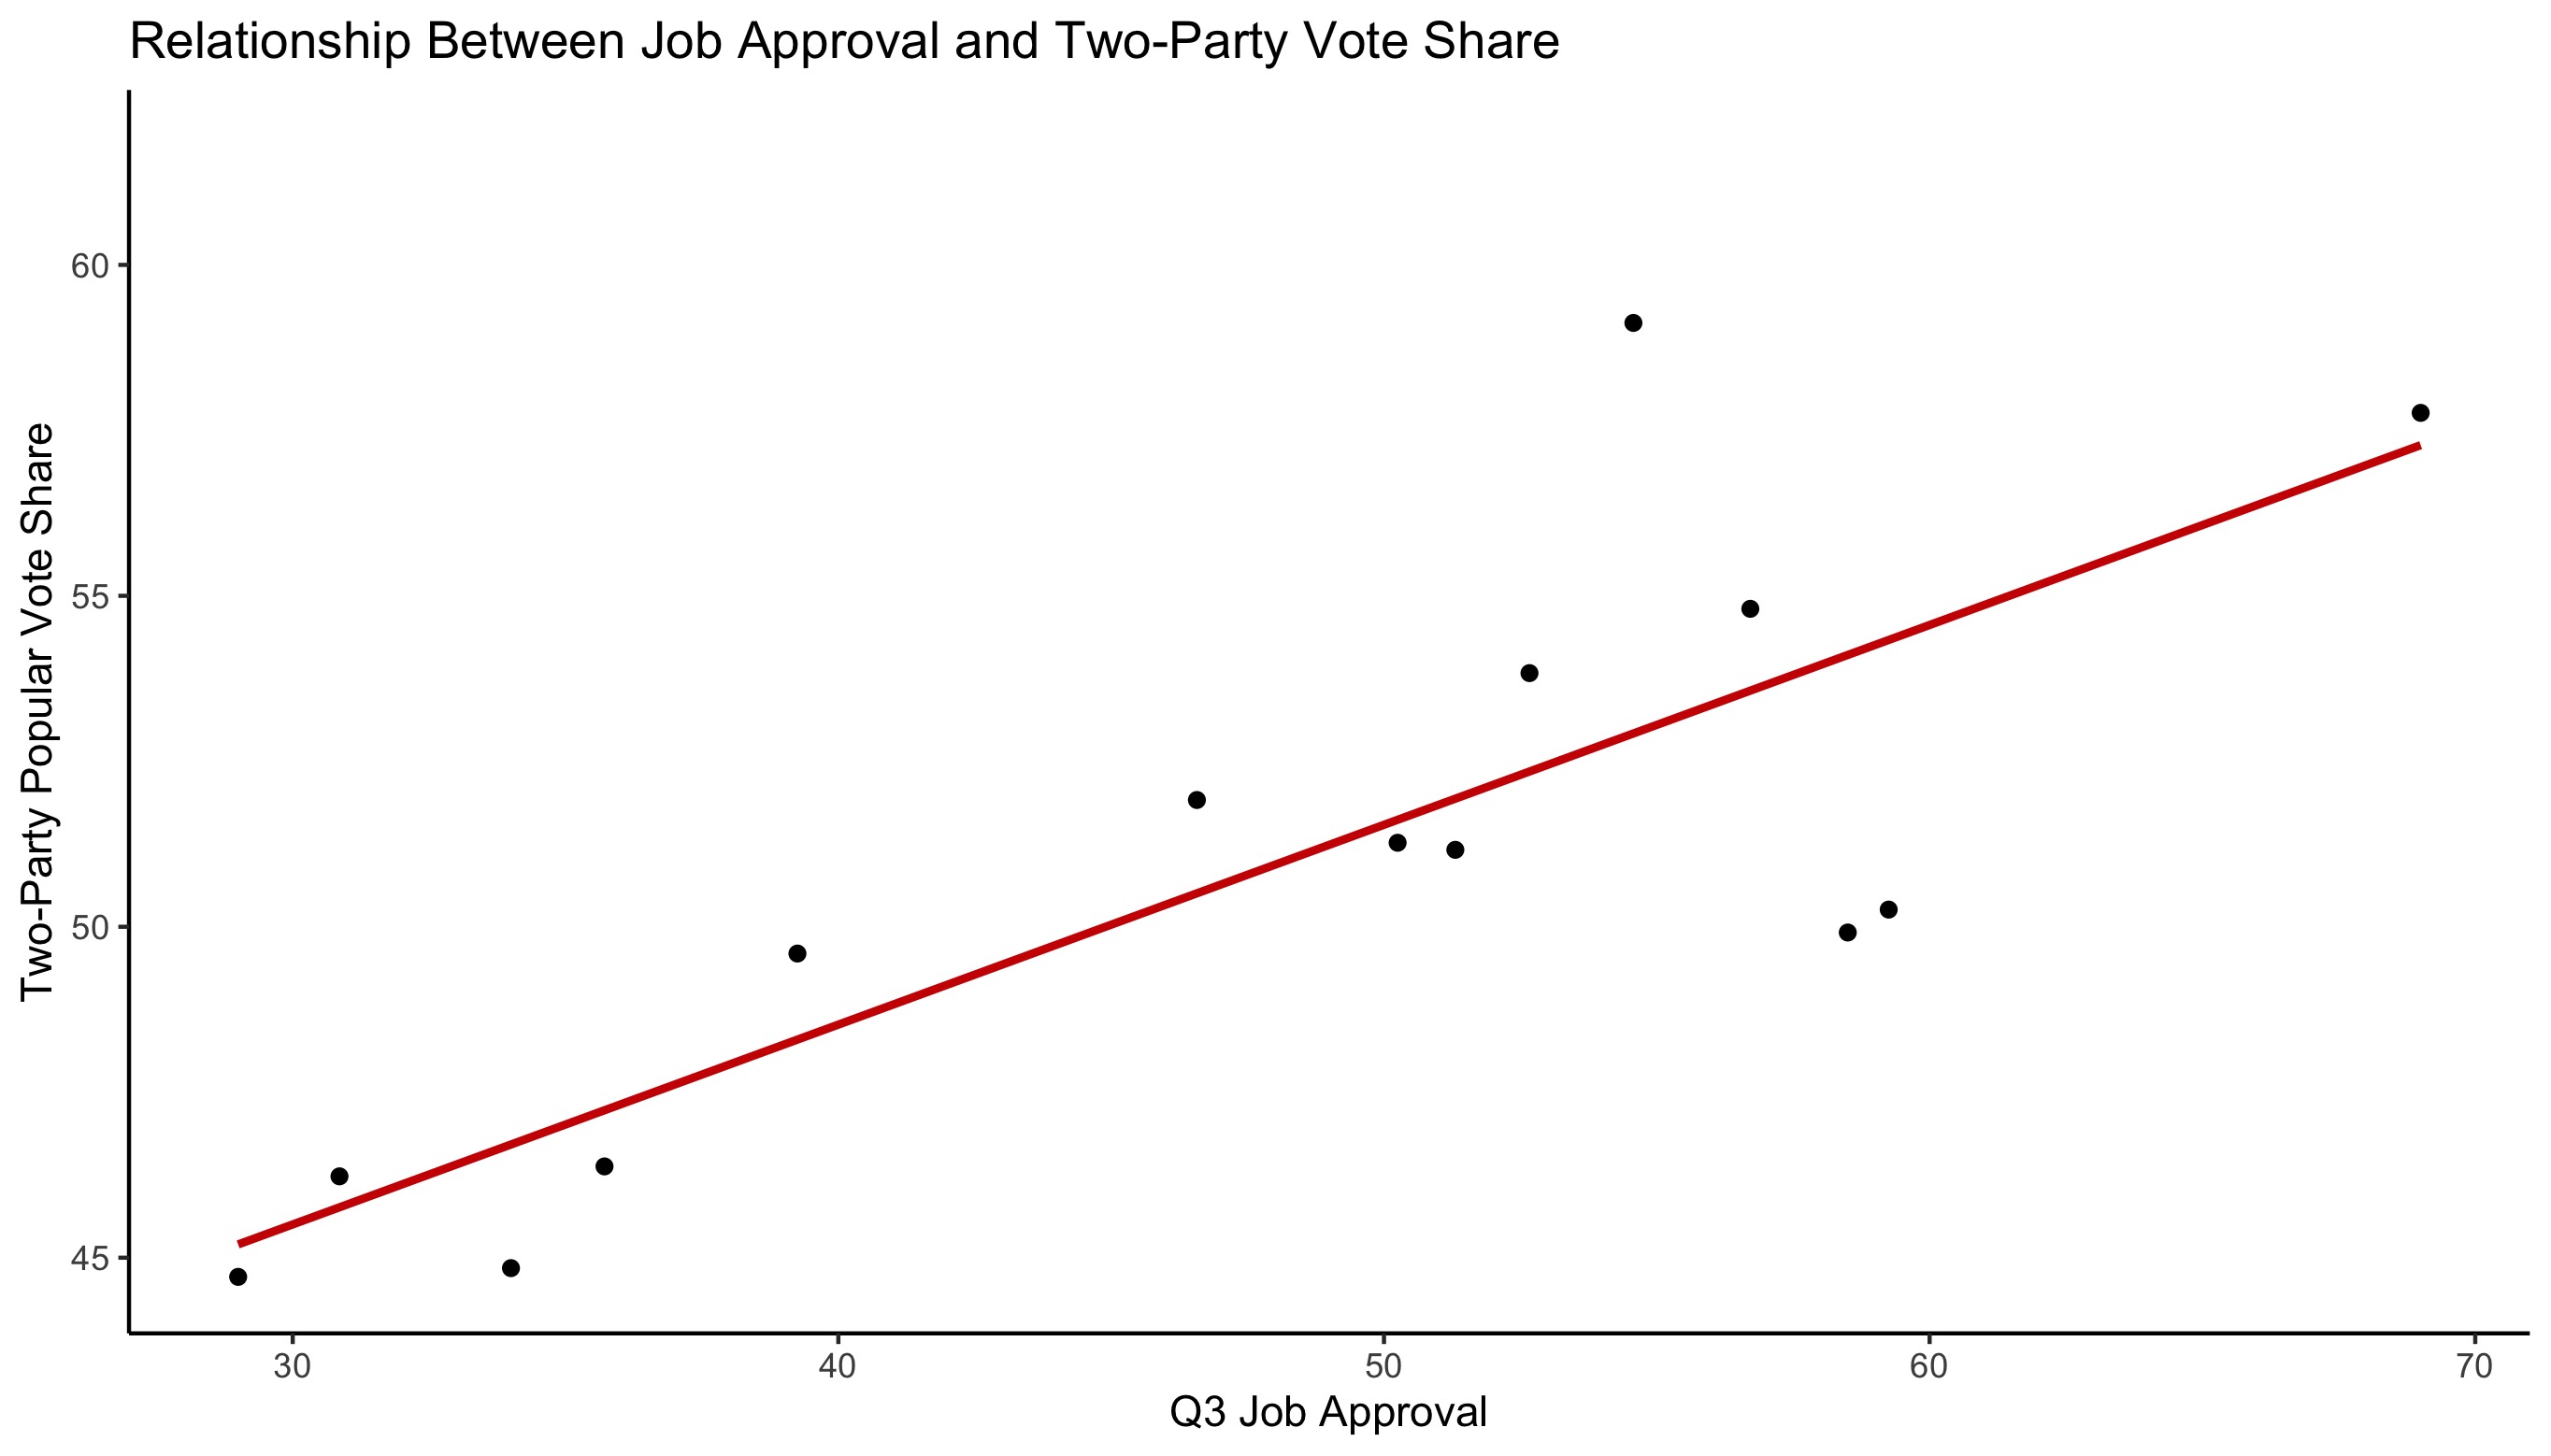
Through the economic storm in the past few months, however, President Trump’s economic approval rating has remained relatively stable. To account for this gap between public opinion and economic data, I added Q3 job approval as an additional variable for Model 2.5 I chose to focus specifically on Q3 election-year approval ratings because voters assign greater weight to performance at the end of the president’s term,1 and the job approval dataset had up-to-date approval numbers for Donald Trump. The below plot shows a positive association between Q3 job approval numbers and incumbent party vote share with historical data:
The regression mapping the incumbent party’s popular vote by the interaction between Q2 GDP growth and Q3 job approval does not reveal a significant relationship between vote share and the interactions between incumbency status and GDP or approval. For every single point increase in Q2 GDP growth, incumbent candidates experience an additional insignificant boost of 0.15 in the popular vote relative to non-incumbent candidates. Similarly, incumbents also experience an average insignificant boost of 0.15 points in the two-party vote share relative to non-incumbent candidates for every point increase in Q3 job approval ratings. Q3 job approval on its own, however, does have a statistically significant relationship with two-party vote share. On average, every single point increase in job approval accompanies an approximate increase of 0.183 percent in the popular vote.
After performing leave-one-out cross-validation for every post-WWII election, the out-of-sample residuals for the popular vote estimates mostly lie within 3 percentage points and do not show any distinct pattern in the residual plot. When predicting Donald Trump’s two-party popular vote share for 2020 using his incumbency status, Q2 GDP growth, and Q3 job approval ratings, Model 2 estimates that he will receive approximately 38.5% of the popular vote.
Model 3: Incumbency Status, Q1 GDP Growth, and Job Approval
While Model 2 yields a slightly more realistic prediction, it still seems overly optimistic about Biden’s chances, largely due to the massive drop in Q2 GDP. To amend that, I replaced Q2 GDP with Q1 GDP in Model 3. Using Q1 GDP growth instead of Q2 accounts for some of the economic impact of COVID-19, but it does not restrict the model to the worst economic quarter of Trump’s presidency and recent history.
The regression for Model 3 yields significant variables of Q3 job approval, incumbency status, the interaction between incumbency and Q1 GDP growth, and the interaction between incumbency and Q3 job approval. This shows that the Q1 GDP growth and Q3 job approval are significantly associated with a greater share of the two-party popular vote for sitting presidents compared to new candidates of the incumbent party, with average boosts of 3.34 and 0.26, respectively.
Model 3’s leave-one-out cross validation shows uniformly scattered residuals and the full model predicts that Donald Trump will earn approximately 42.5% of the two-party popular vote.
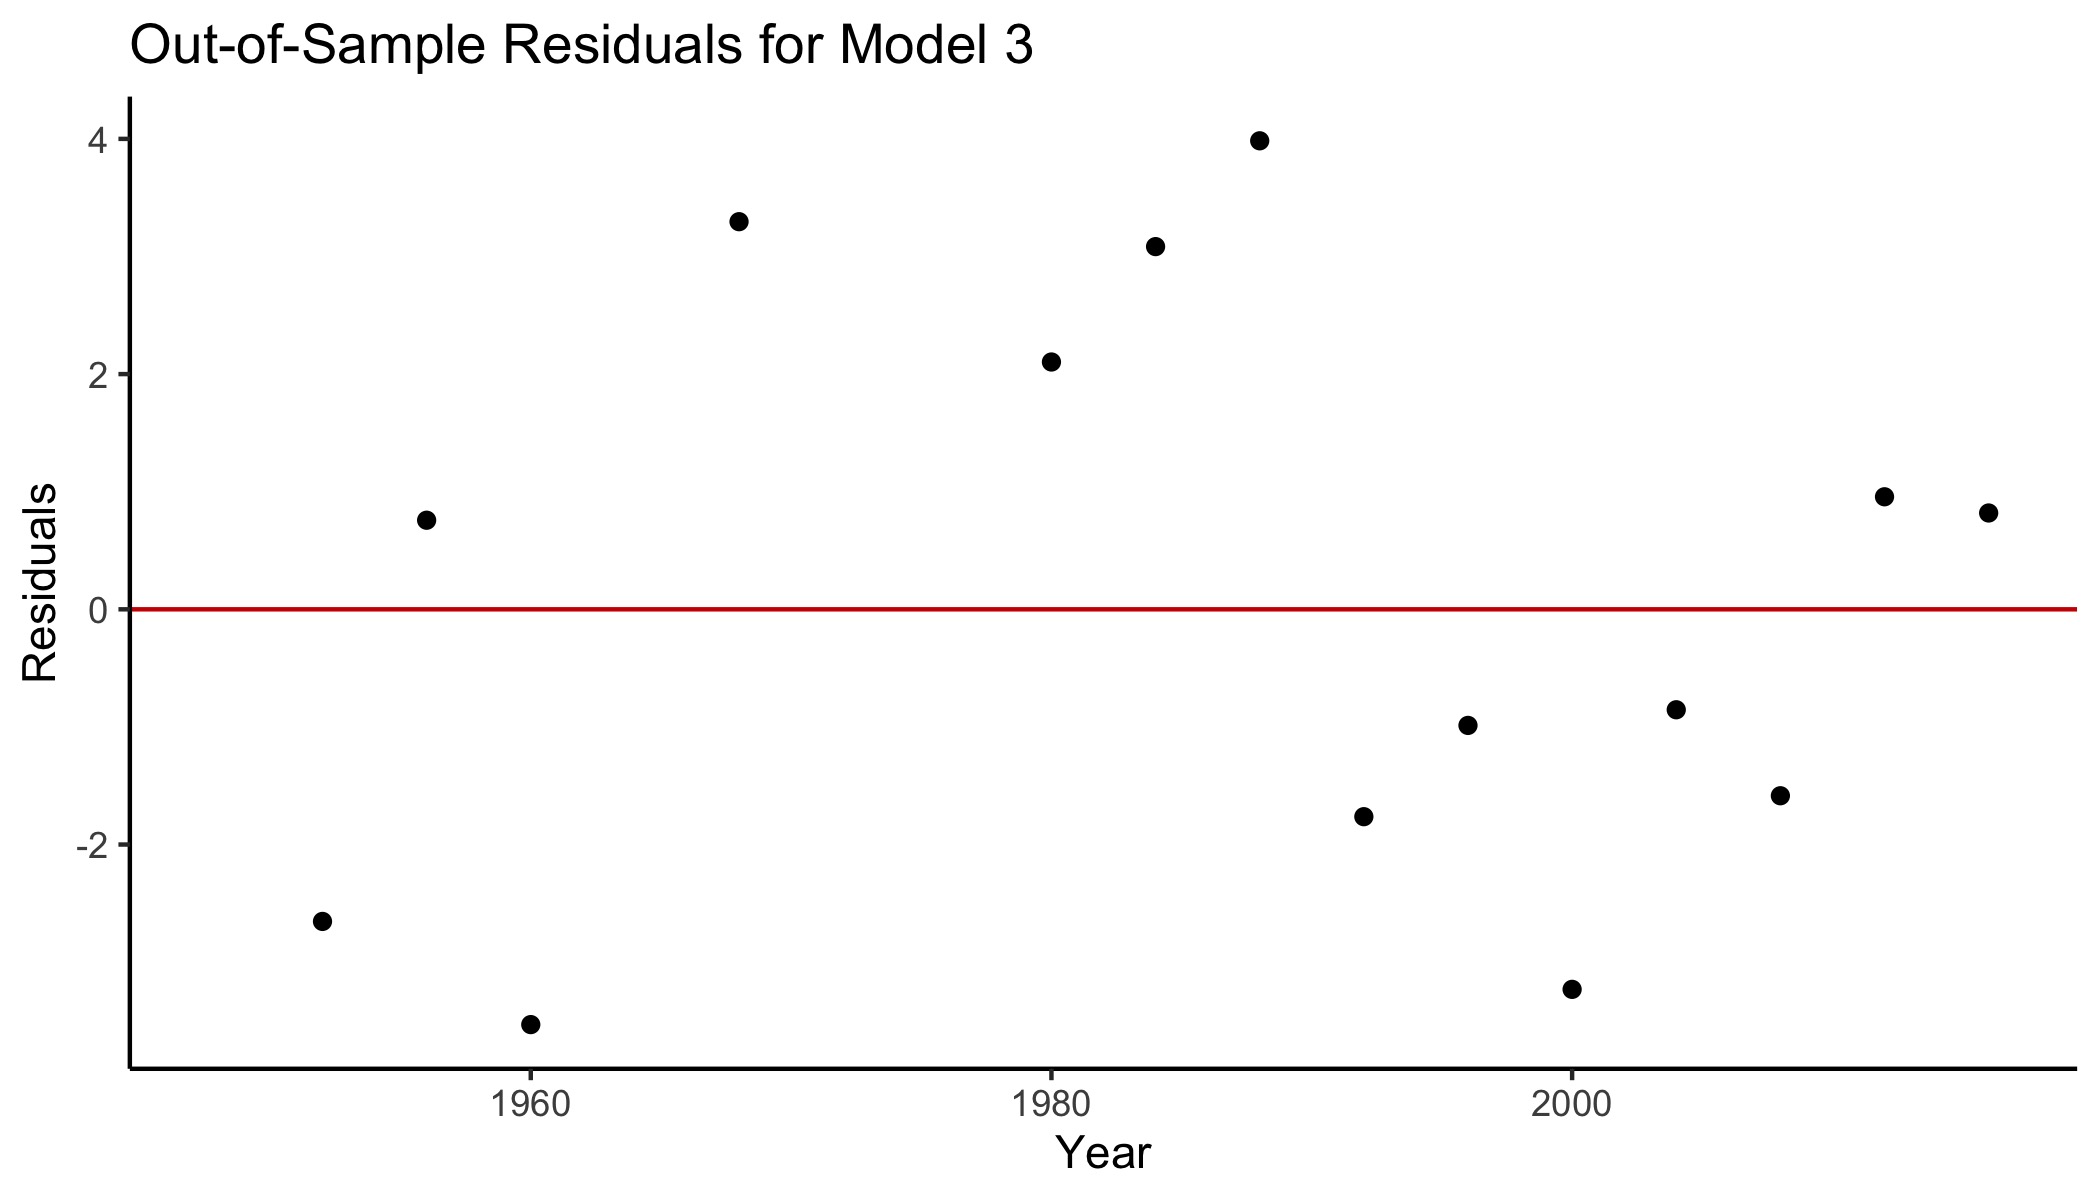
Model Comparison and Conclusion
The literature suggests that voters subconsciously assign greater weight to more recent economic conditions, but Model 3, which used Q1 GDP growth, actually yielded a greater adjusted r-squared value than Model 2, which used Q2 data.
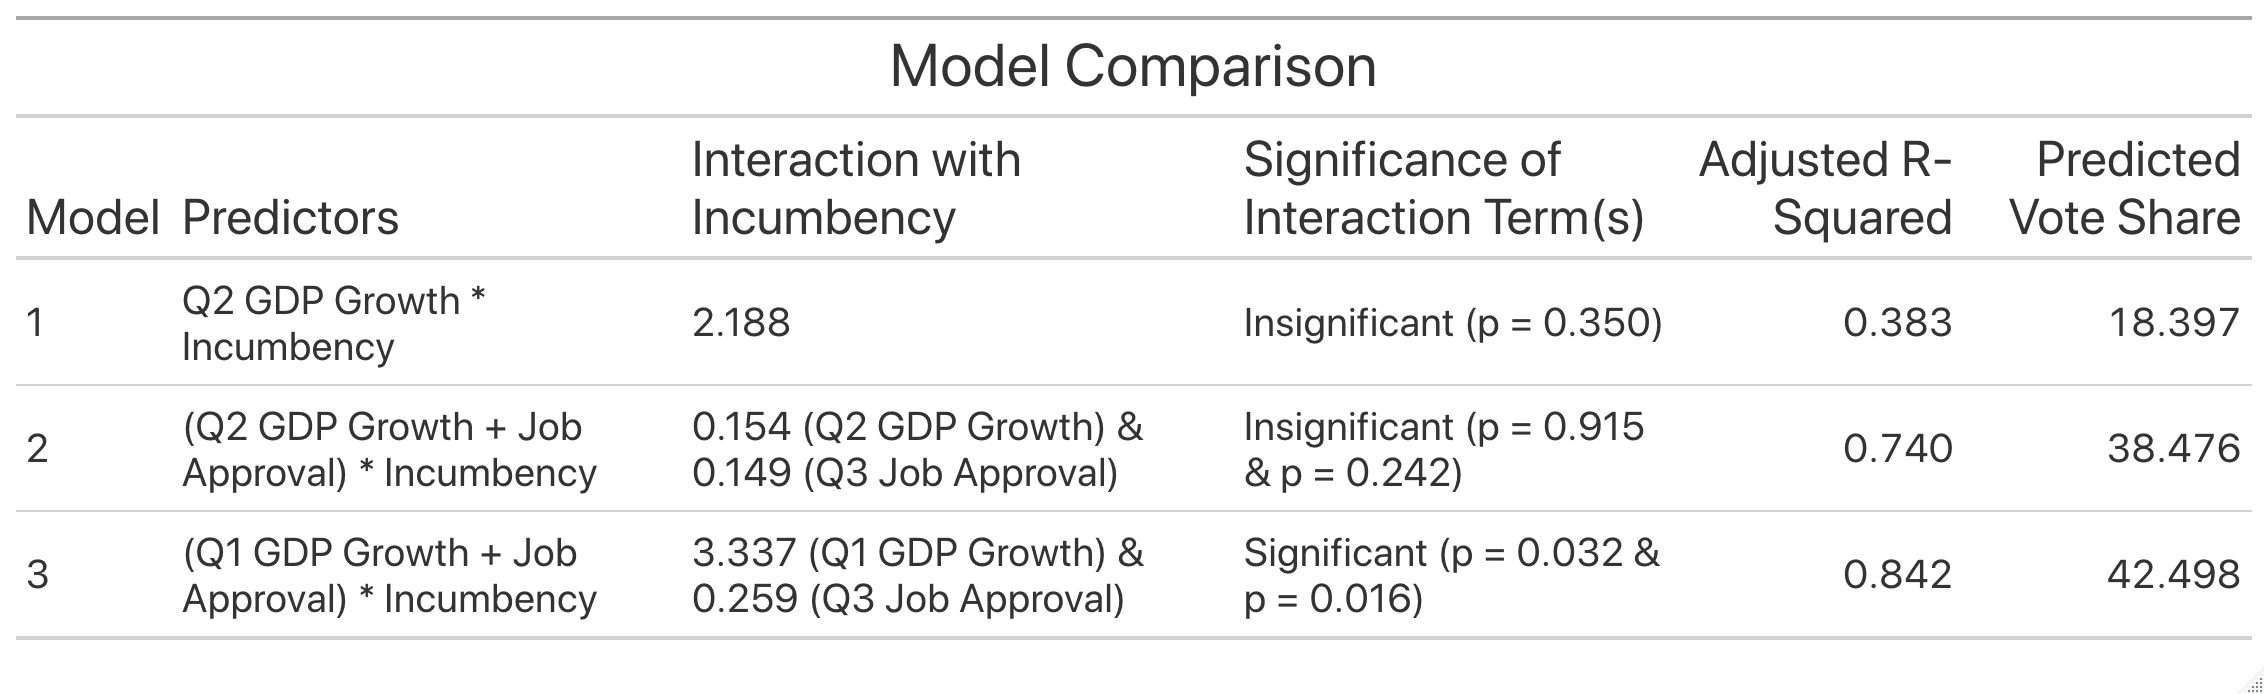
Model 3 accounts for approximately 84% of the variation in the incumbent party’s two-party vote share in post-WWII elections, compared to only 74% in Model 2. Not only did Model 3 account for the most variation with the historical data, but it also gave the highest estimate for Donald Trump’s predicted vote share in 2020. While the prediction is the highest among the three, it still has him losing to Biden by a sizable margin.
Also worth noting is that Model 3 reveals that incumbent candidates tend to experience a significant boost in the two-party vote share for increases in Q1 GDP growth and Q3 job approval ratings relative to non-incumbent candidates from the incumbent party. Since Model 3 is the strongest model, it supports the notion that, on average, incumbent candidates reap greater rewards than new candidates from the incumbent party for economic conditions.
Limitations with Economic Data
By mid-March, COVID-19 had reached all 50 states. While Q2 economic numbers ordinarily serve as good predictors for presidential elections, real GDP decreased at an annual rate of 32.9% in the second quarter. The below visualization, which replicates a similar graphic from the New York Times, displays GDP growth in Q2 relative to the previous quarter, beginning in 1947:
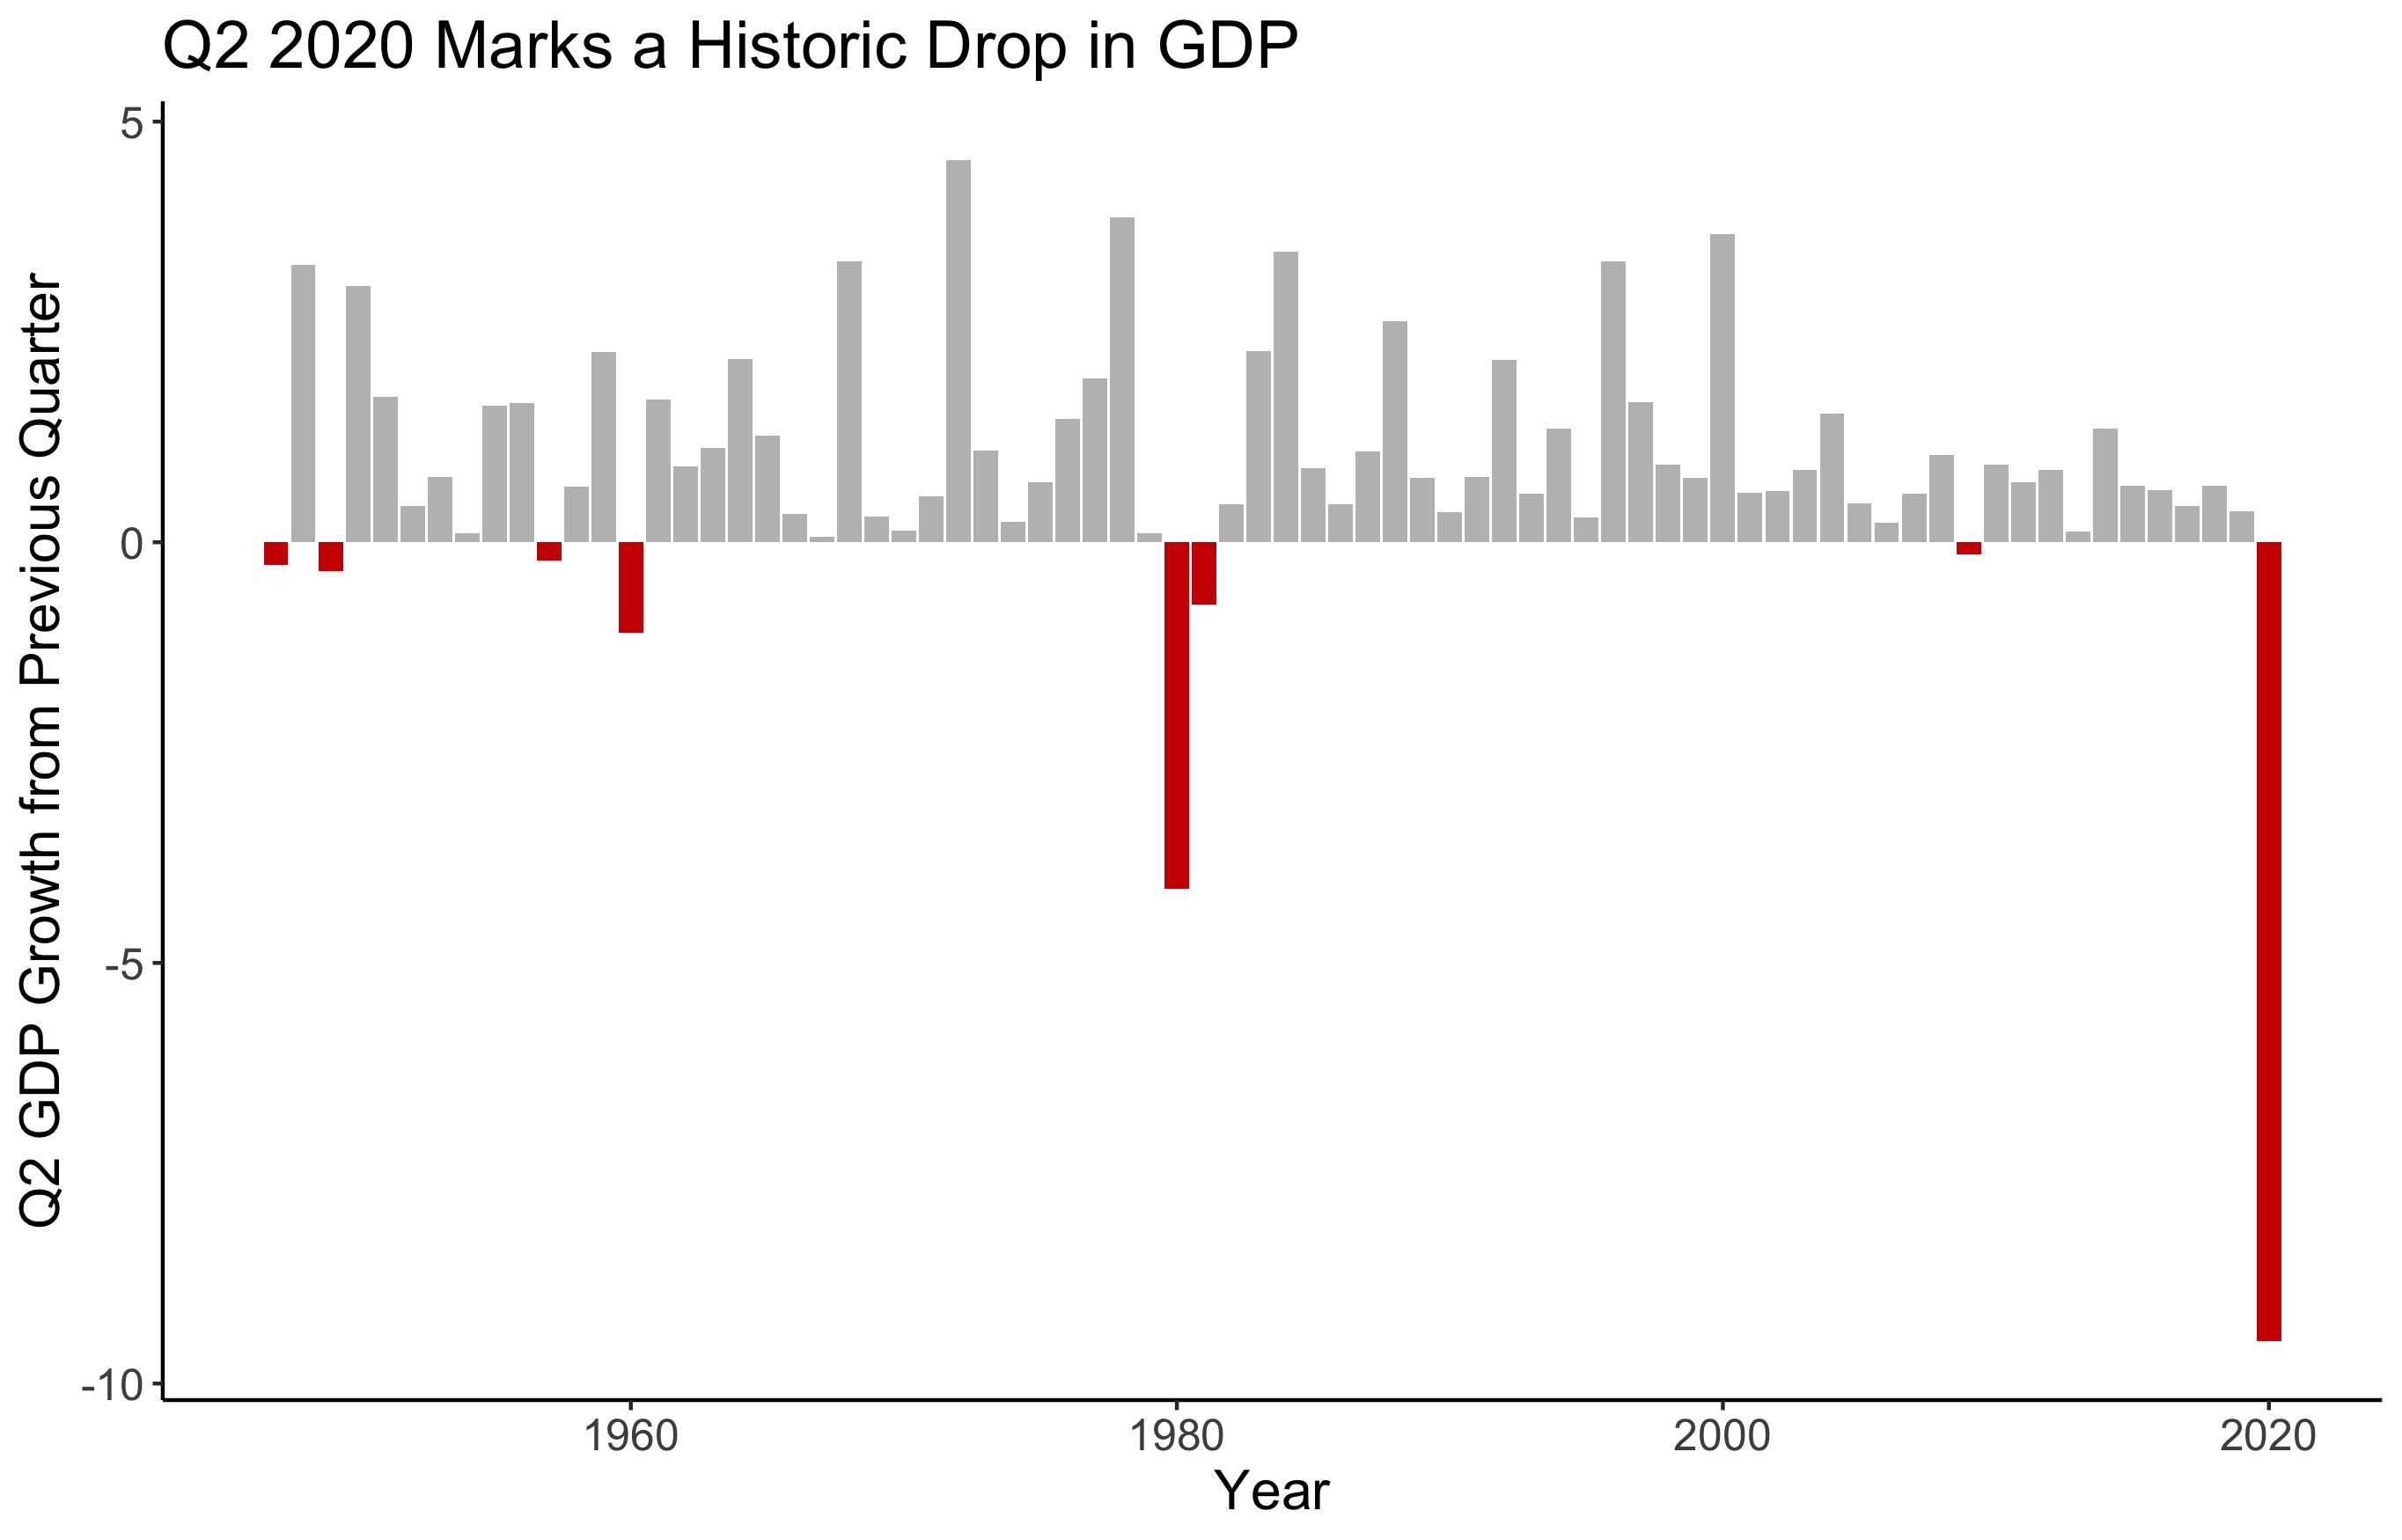
History provides no guide for the economic extremes resulting from COVID-19. The unprecedented nature of this economic situation forces models to extrapolate from economic data of an already limited sample size, making predictions unreliable. While the US has only held 58 presidential elections in its history, the GDP data only dates back to post-WWII elections, bringing the tally down to 18.
Forecasters cannot simply acquire a larger sample size of presidential elections or more historic economic extremes to improve the forecast models; instead, models must look beyond basic economic data. Most election forecasts incorporate a mixture of political and economic indicators in their models,6 and adding non-economic variables to the model in future weeks will lead to closer predictions for the outcome of the 2020 election.
-
[Healy and Lenz, 2014] Healy, A. and Lenz, G. S. (2014). Substituting the End for the Whole: Why Voters Respond Primarily to the Election-Year Economy.American journal of political science, 58(1):31–47. ↩ ↩2
-
GDP growth (national): 1947-2020 (US Bureau of Economic Analysis, Department of Commerce) ↩
-
All measures of significance use a significance level of 0.05. ↩
-
While Donald Trump’s incumbency status would ordinarily boost vote share, it actually hurt him in the case of this model. The interaction between incumbency and Q2 GDP growth gives incumbents an approximate boost of 2.2 points relative to non-incumbents for each percent increase in GDP growth. However, every single point decrease in Q2 GDP hurts incumbent candidates by 2.2 points more than non-incumbent candidates. ↩
-
Ideally, I would have incorporated data on economic approval rather than overall job approval, but I could not find a dataset with historic economic approval numbers for post-WWII presidents. However, I have reason to believe that job approval is a good stand-in because, as of 9/19/2020, 50.5% of Americans approval of Donald Trump’s economic performance, while only 44.8% approve of his overall performance as president. So, while the economy is in its worst state in recorded history, using the job approval numbers actually give him less of a boost than if I were to use his economic numbers. Using the same models but plugging in Trump’s current economic approval rating yields a predicted vote share of 41.411% by Model 2 and 46.494% by Model 3. ↩
-
[Ardoin and Gronke, 2016] Ardoin, P. and Gronke, P. (2016).PS: Political Science and Politics: Symposium: Forecasting the 2016 American National Elections. 49(4). ↩