2020 Presidential Election Analysis
Kayla Manning, Harvard College
Voter Turnout
October 17, 2020
Turnout in 2020
Democracy cannot function as intended if voters neglect to show up at the polls. Over the years, the size of the voting-eligible population and the percentage of those casting ballots have generally1 increased:
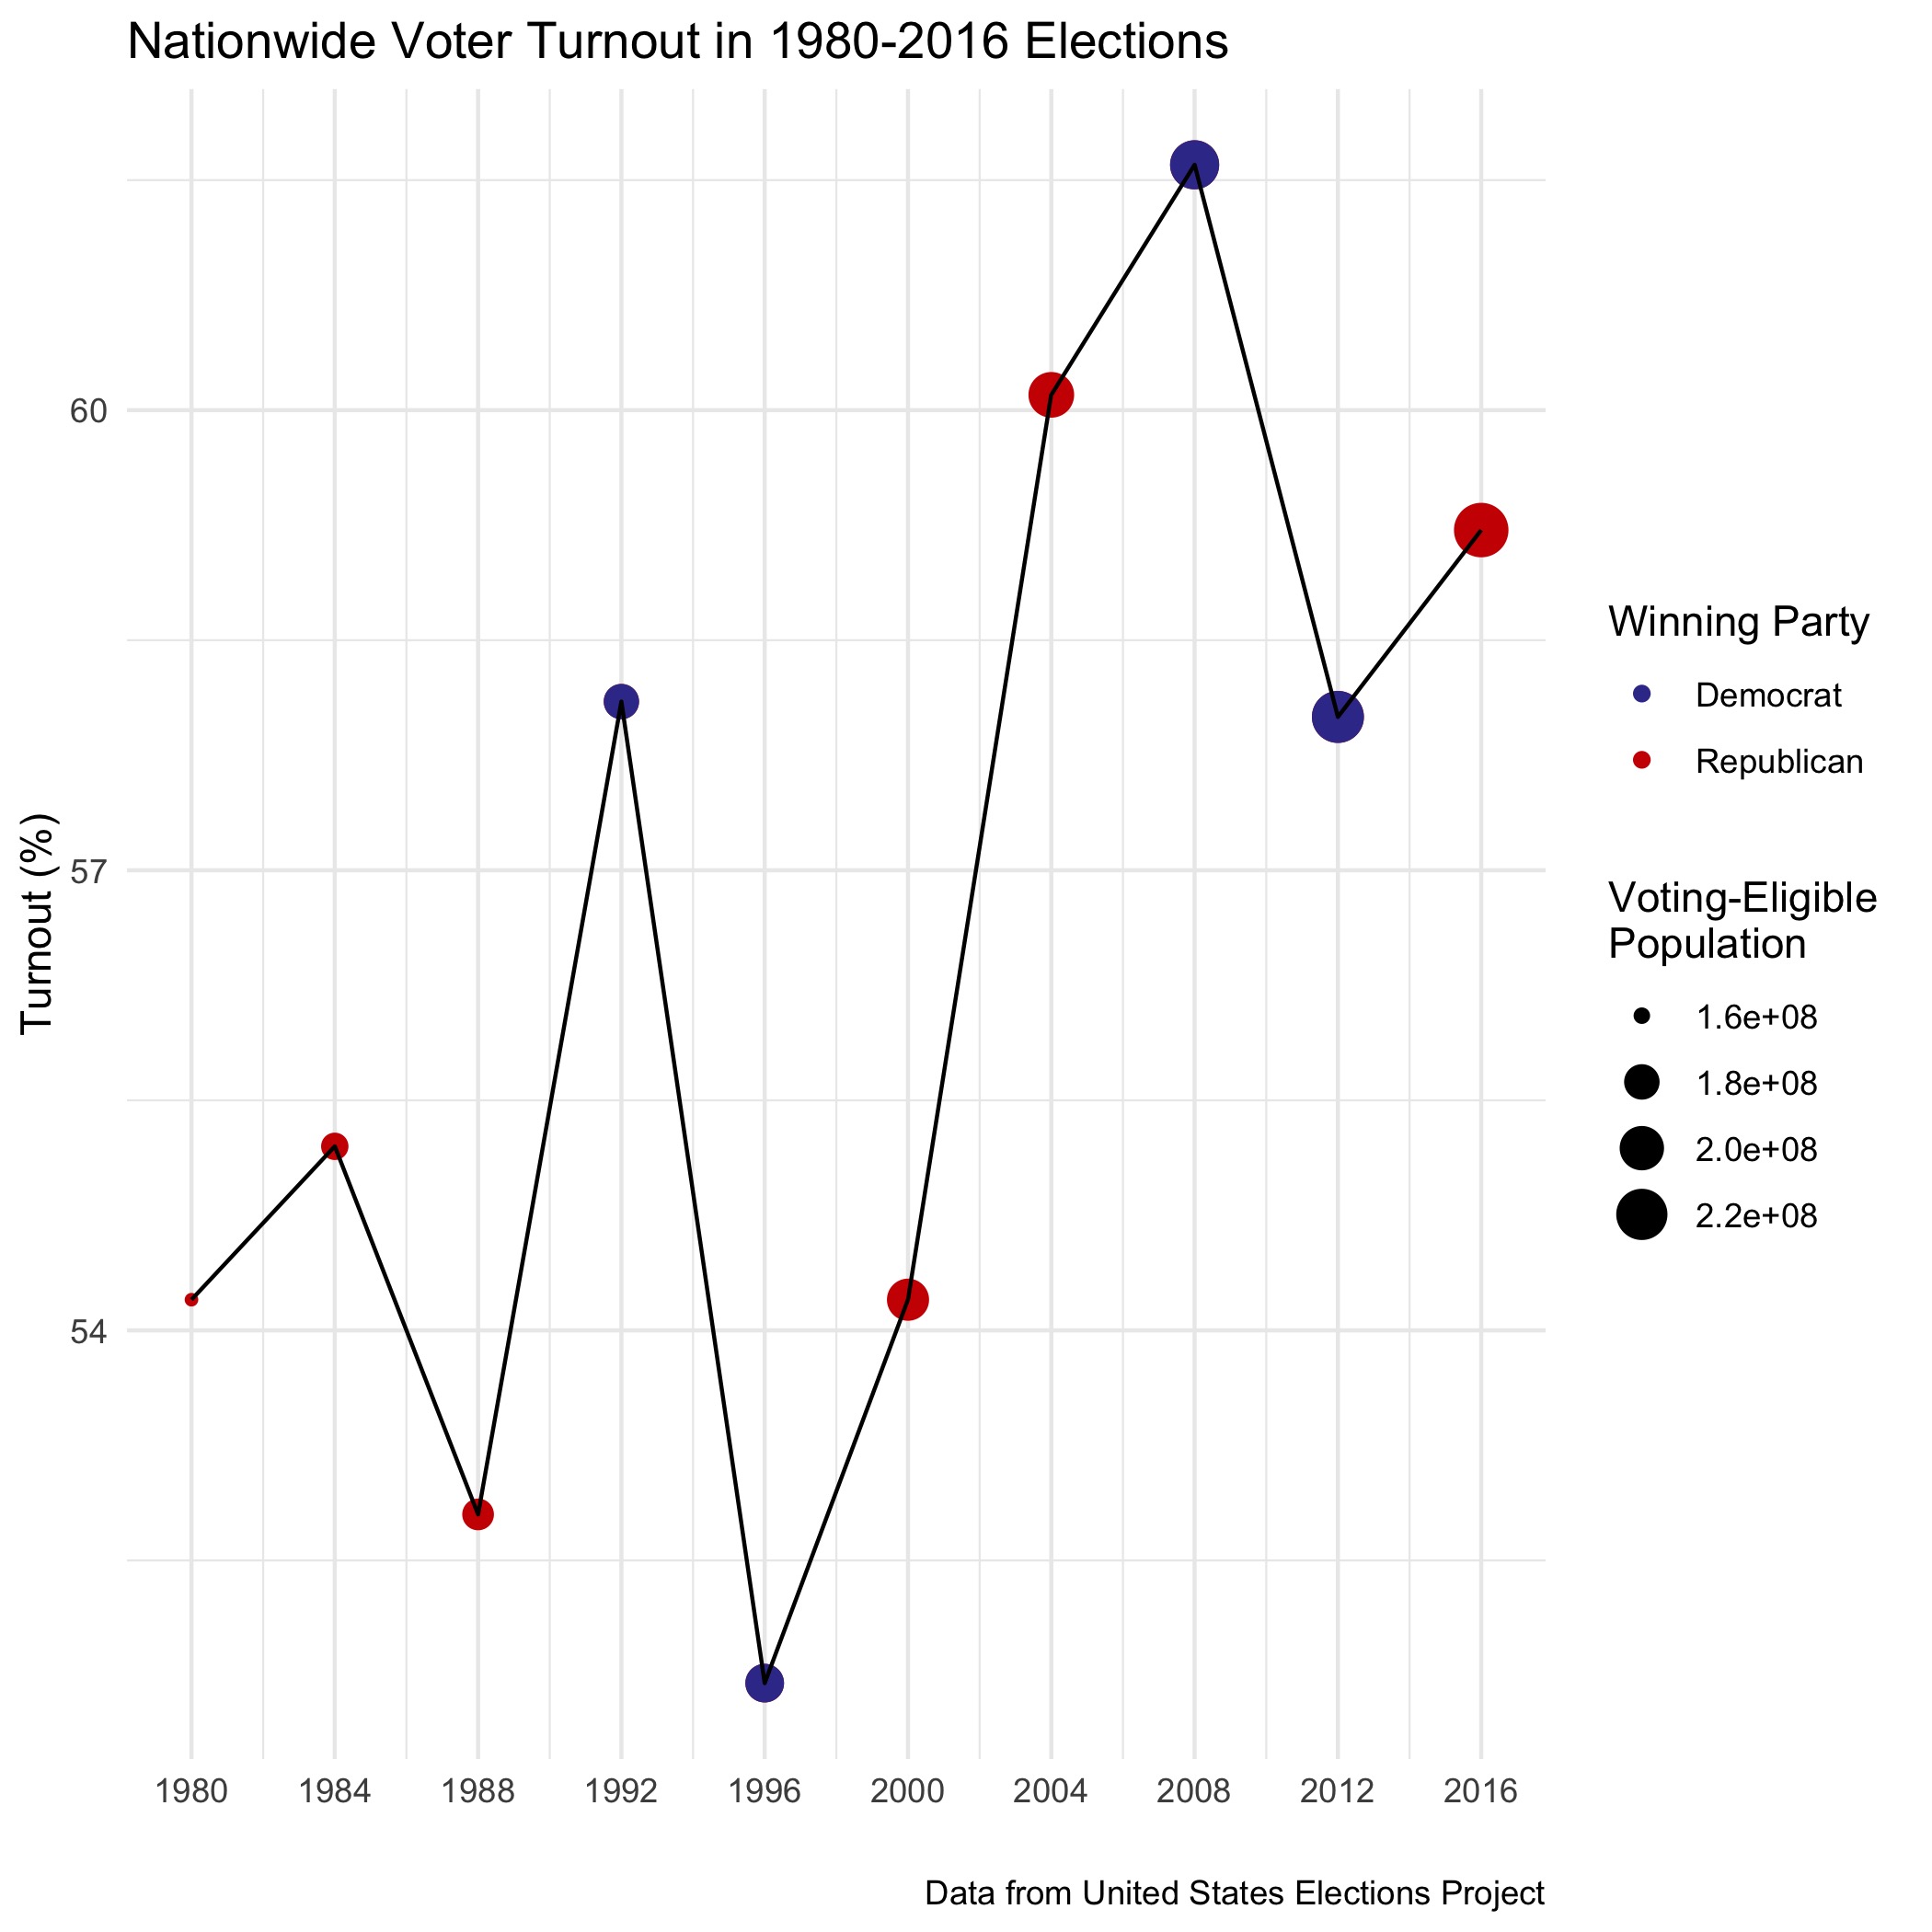
Where will voter turnout in 2020 fall onto this graph? Before the advent of COVID-19, experts in 2019 predicted a historic turnout of approximately 66% of the voting-eligible population2 for the 2020 election. However, it would be naive to blindly assume that the same assumptions from these forecasts hold in the present circumstances. Voter turnout could easily increase or decrease due to the pandemic, depending on whether voters are (a) hindered by confusion over voting by mail3 and safety of in-person voting, or (b) energized by the belief that their candidate can lead our country through these turbulent times.
With a sample size of zero previous elections resembling 2020, this year’s primaries provide the best insights on voter behavior during a global pandemic. Turnout in primaries generally pales in comparison to general election turnout, with numbers sitting around 3%-46% and 60% respectively, and this gap in turnout widens in years where the sitting president seeks re-election. However, the 2020 primary drew far more attention than expected. While most of the showing came from the Democratic side since Donald Trump did not face any viable challengers, this larger-than-expected turnout provides a positive sign that COVID-19 will not drastically decrease, and could potentially even increase, turnout come November.
Indeed, it turns out that experts still expect a record-high turnout in the 2020 election, with the predicted surge strengthened by the pandemic. Consistent with the prediction from 2019, estimates still sit around 65%.
How FiveThirtyEight’s Forecast Adjusts for Unpredictability
While we have ruled out that COVID-19 will guarantee lower voter turnout, forecasters must still grapple with increased levels of uncertainty in turnout numbers. Nate Silver’s forecast at FiveThirtyEight considers the following factors as it accounts for unpredictable voter turnout and uncertainty in Election Day results:
- Relative ease of voting in each state - generally, easier voting leads to higher turnout and an increased proportion of Democratic votes.
- Projected turnout by state - the model accounts for state population growth since 2016, changes in the relative ease of voting since 2016, and current closeness of the race, since closer-polling states tend to experience higher turnout.
- Variability in primary turnout - turnout in primaries was approximately 50% higher in primaries after COVID-19 came to the US than before.
- COVID-19 made turnout in primaries more difficult to predict; voting by mail made voting easier in certain states, while difficulties with social distancing at in-person polls added a barrier for other voters.
- States with drastic shifts in turnout between election cycles are more difficult to forecast.
With the above factors in mind, Nate Silver estimates a 50% increase in error when predicting voter turnout and a 20% increase in error when predicting vote share for each party. As a result of how COVID-19 may affect turnout and the voting process, FiveThirtyEight’s model increased Election Day error, correlated state error, and state-specific error by 20% relative to typical values. While FiveThirtyEight certainly does not stand as the sole election model, Nate Silver seems to take a much more elaborate and well-rounded approach to the current circumstances than other forecasts.4
Modeling Election Outcomes with Variability in Turnout
Curious about the impact of fluctuations in turnout, I created state-level and national models that run thousands of simulations representing various levels of turnout5 for the 2020 election. Different turnout numbers did not lead to different election outcomes.6 The state-by-state model helps to visualize possibilities with the Electoral College, and the national model simulates possibilities for the nationwide popular vote. The two binomial logistic regressions incorporate slightly different variables depending on the available data, and this variation in model construction provides different possibilities for election day results. While neither model is perfect, these simulations laid the groundwork for improvements in weeks to come.
State-by-State Model
To simulate vote counts for the Electoral College, I constructed a binomial logit model for each state, estimating the vote counts using poll numbers,7 Q1 GDP growth, change in the Black population in the past year, change in the Hispanic population in the past year, change in the population in their 20s in the past year, the number of consecutive years that the state has voted Democrat or Republican, and the percent margin of the Democratic vote in the previous election. For each state, I simulated 1,000 elections with various levels of voter turnout.
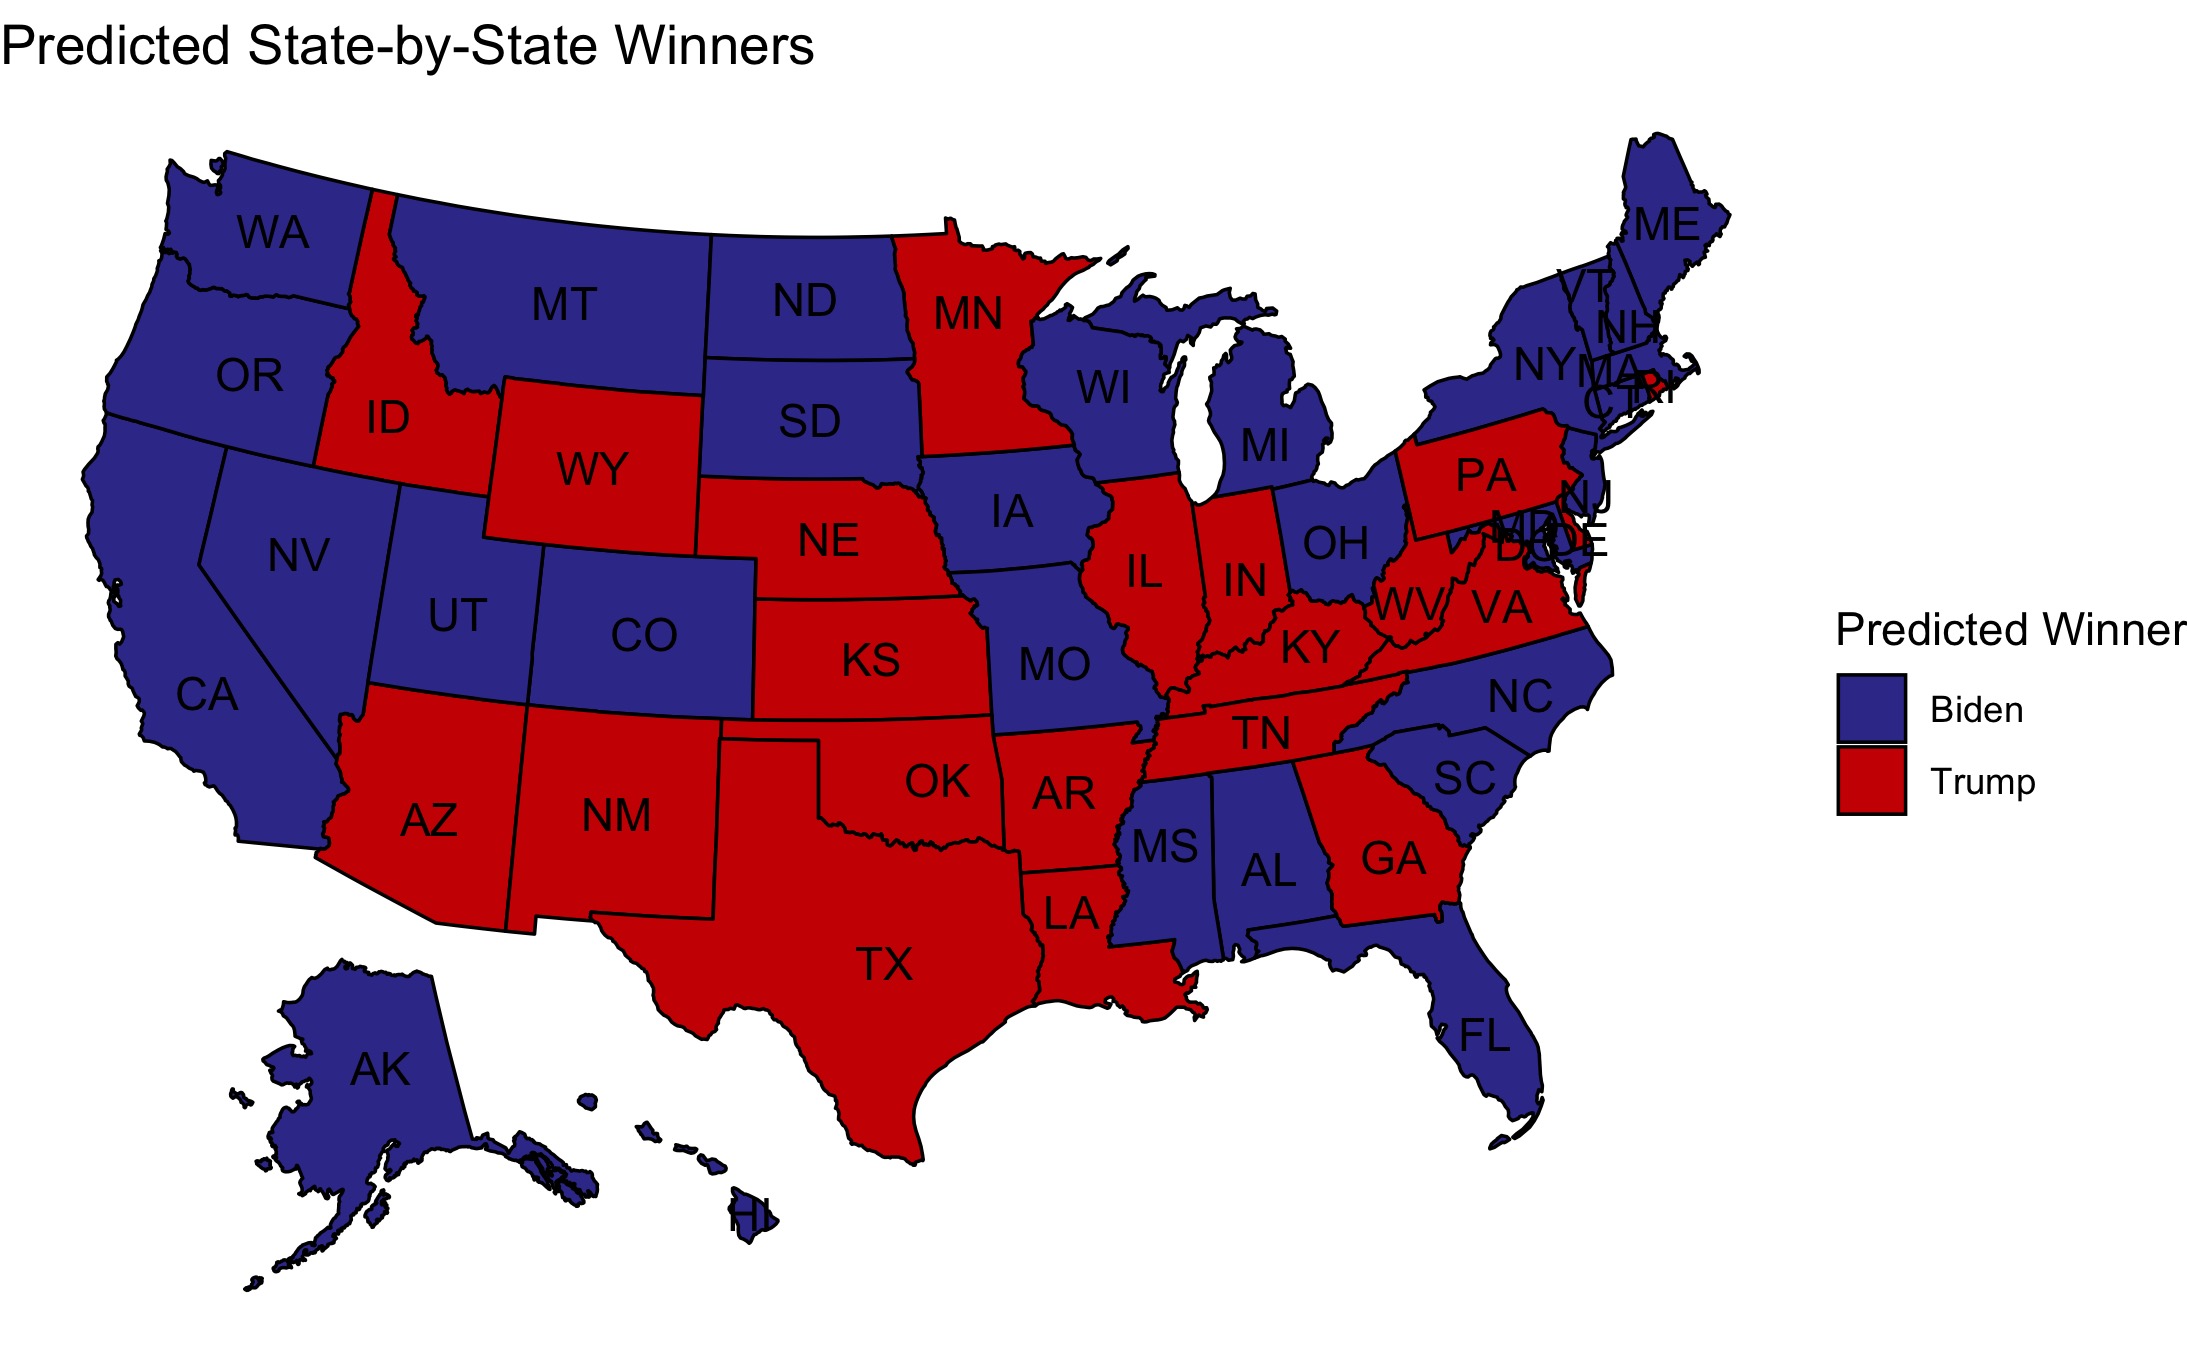
This model yielded a prediction of 321 electoral votes for Biden and 214 for Trump, with Biden winning approximately 50.7% of the popular vote. This model does exclude Washington D.C. and its 3 electoral votes since it was missing statewide data. Since D.C. reliably votes Democratic, I can comfortably build upon this prior prediction to estimate that Biden will receive 324 electoral votes and Trump will receive 214.
| Candidate | Electoral Votes | Two-Party Popular Vote |
|---|---|---|
| Biden | 324 | 0.507 |
| Trump | 214 | 0.493 |
Given what we know about states’ tendencies to swing one way or another, this map does not seem too outrageous. However, this model could use some improvement. Several core Republican states–such as Alaska, Mississippi, and Alabama–appear to vote blue under this model. In future weeks, I hope to construct 3 separate models instead of 50: one for reliably blue states, one for reliably red states, and one for swing states. This method will draw from a larger pool of data and construct models for groups of similar states. Following this procedure will minimize the risk of overfitting models for individual states, which caused some unlikely predictions in this 50-model forecast.
National Model
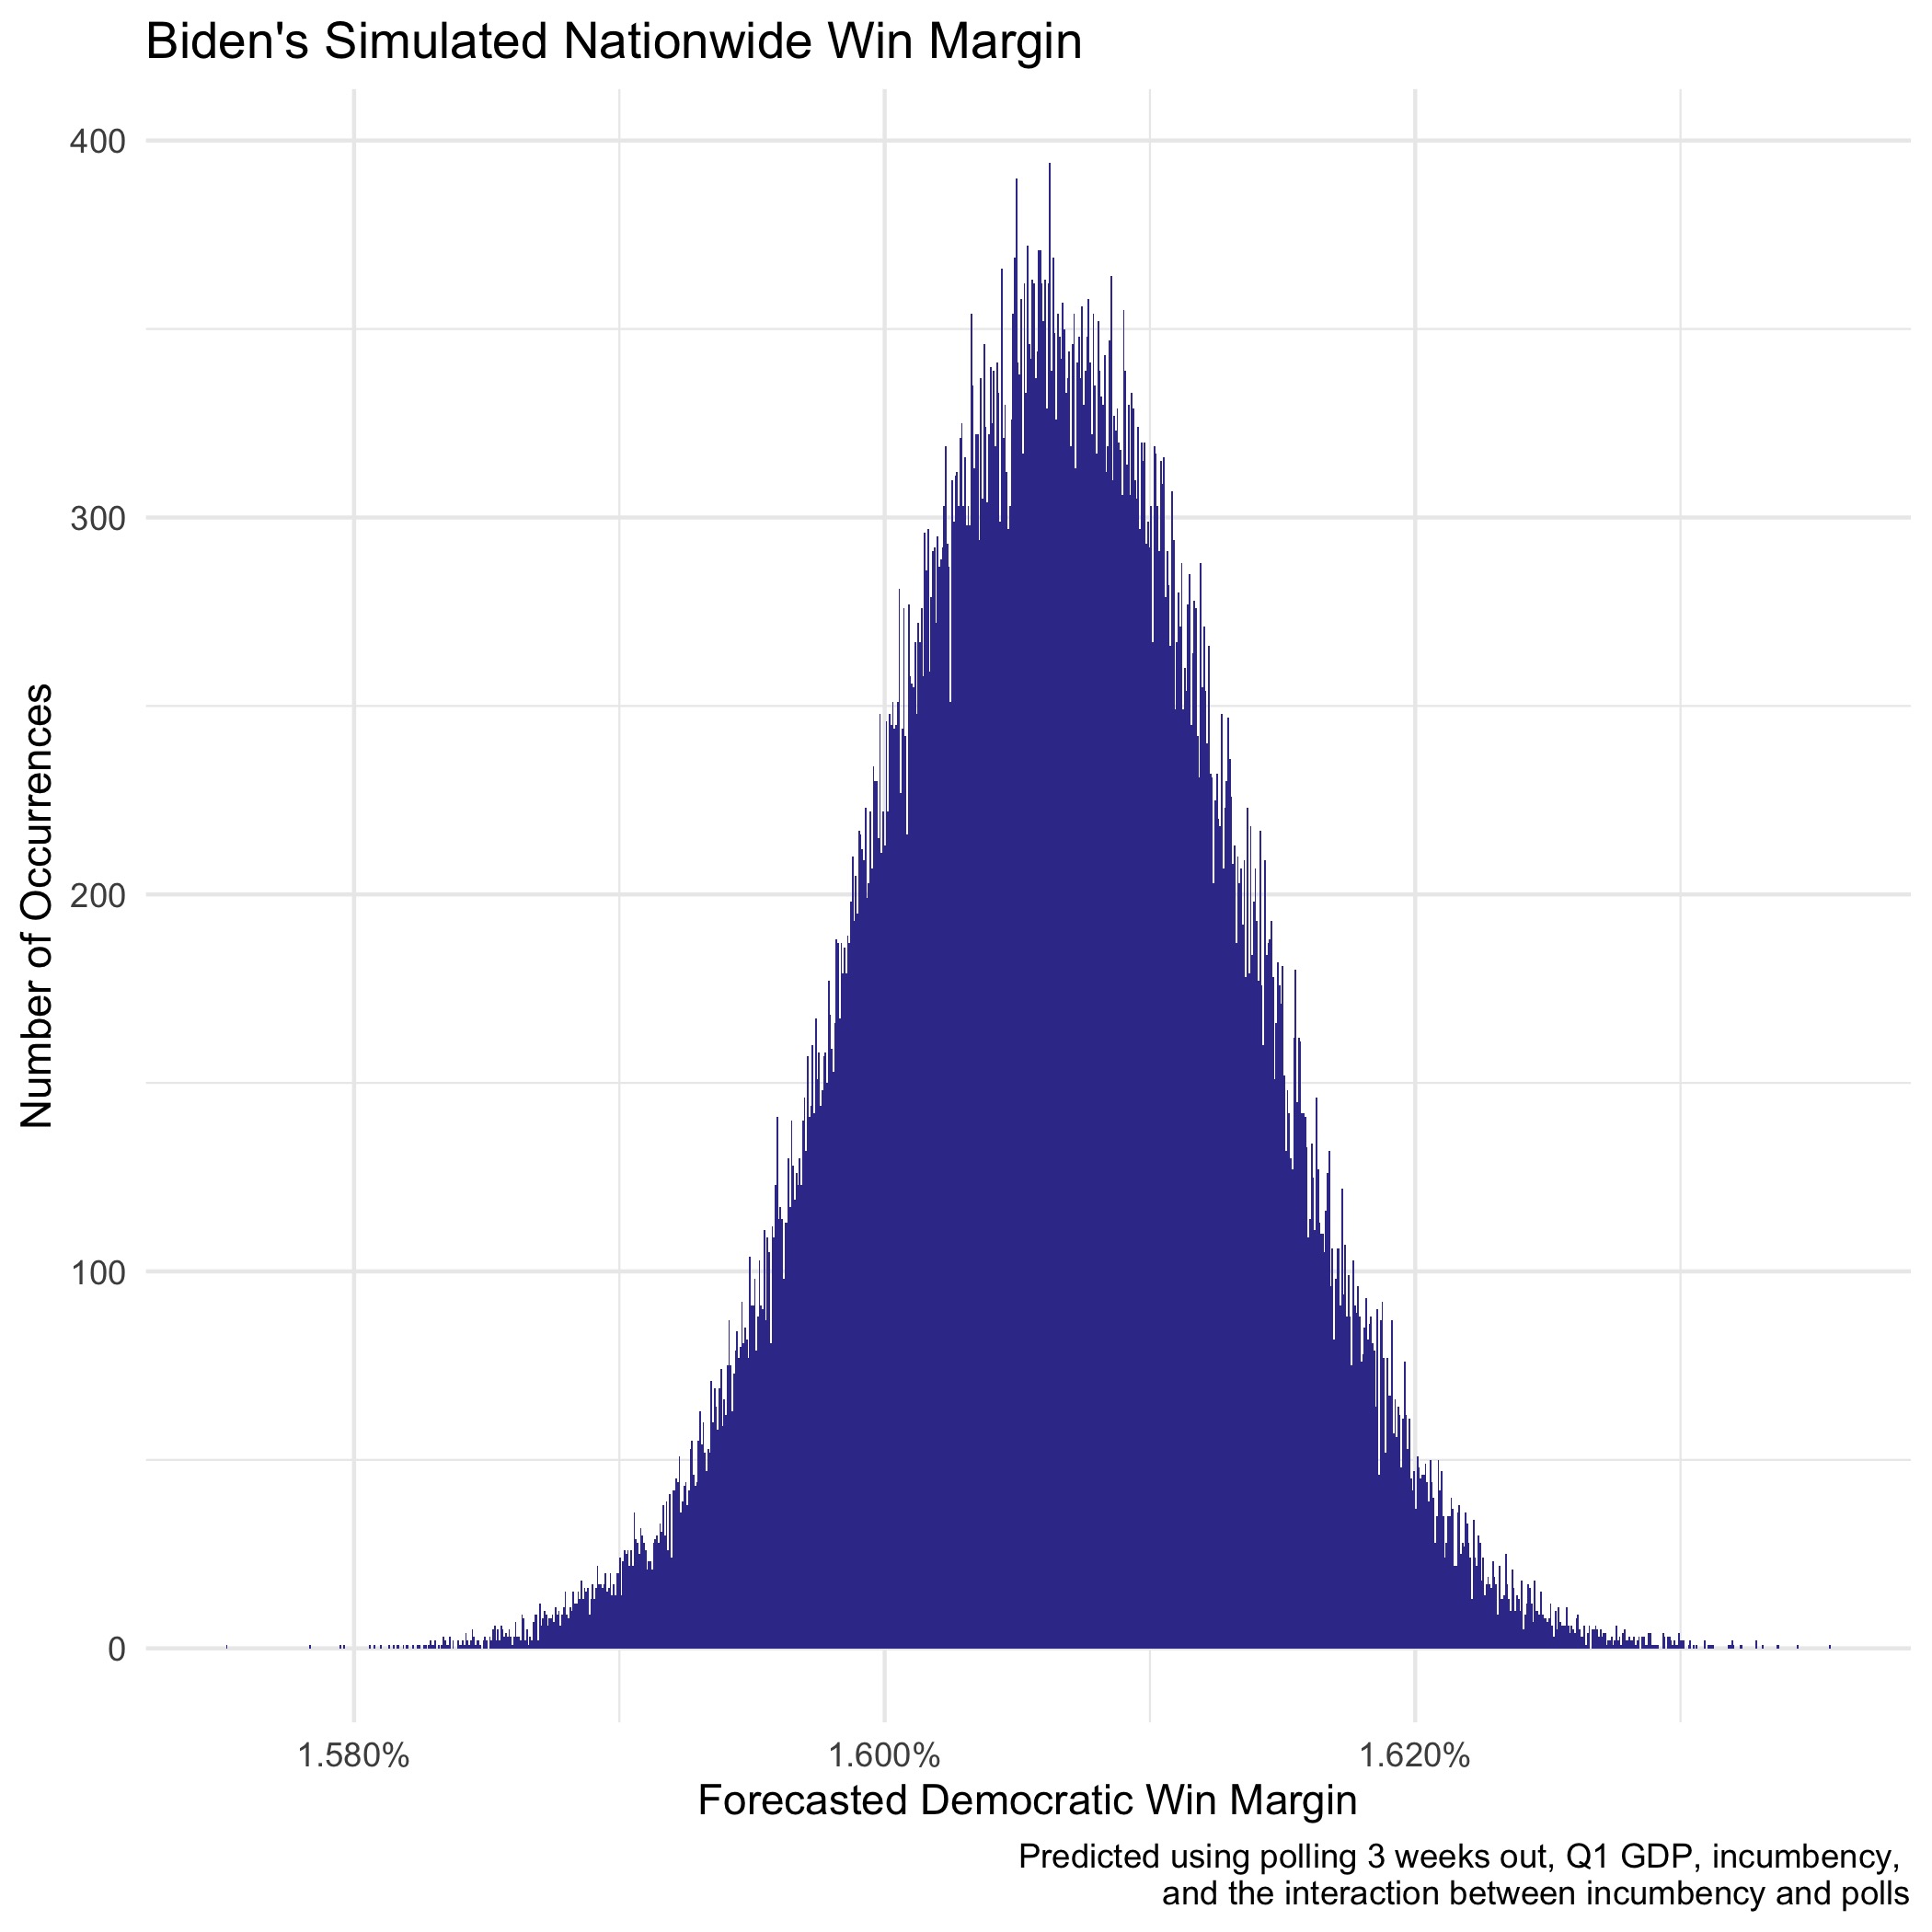
I followed a similar procedure as above to construct a binomial logit model for the nationwide popular vote. This model predicts vote counts for each party using polling numbers, incumbency status, the interaction between polling and incumbency, and Q1 GDP growth. In this model, I ran 100,000 simulations with various levels of turnout.
A national model predicts that Biden will receive approximately 50.8% of the two-party popular vote and Trump will receive the remaining 49.2%. Each simulation predicts that Biden will win the national popular vote by 1.5-1.7% depending on the turnout, as displayed by the below histogram:
Looking Ahead
In forecasting the 2020 election, experts must grapple with uncertainty regarding COVID-19’s impact on turnout. COVID-19’s impact extends beyond turnout, however. The theory of retrospective voting raises the question of how voters may punish or reward the incumbent candidate for the handling of COVID-19, wildfires, hurricanes, racial injustice protests, and more. Next week’s post will examine the impact of shocks and unexpected events on presidential elections.
-
While the aggregate trend is increasing numbers, the numbers reach their peak in 2008. Also, the numbers tend to oscillate up and down depending on whether there is an incumbent candidate, with relatively higher turnout rates in years when a sitting president is not seeking re-election. ↩
-
Turnout percentages reported throughout this post refer to the percentage of the voting-eligible population (VEP) that casts ballots. ↩
-
Different states have different regulations regarding voting by mail. In the presidential primaries, states that encouraged people to vote by mail experienced impressive success. Naturally, states that mailed every voter an absentee ballot saw the greatest share of votes cast absentee, and states that did not mail anything and required a non-COVID excuse to vote absentee had the lowest share of absentee voting. Many Republicans believe that widespread absentee voting will benefit Democrats, so people may attempt to manipulate voting by mail measures to stifle the vote of certain subsets of the electorate. Fortunately, most states requiring non-COVID-19 excuses for absentee voting reliably vote Republican, most states mailing ballots to all voters reliably vote Democratic, and most swing states allow absentee voting for all but do not nudge in one way or another. While the concerns about attempts to manipulate voter turnout are certainly valid, it appears that policies enacted by states will only serve to reinforce existing voting tendencies. ↩
-
The Economist model’s discussions of turnout variability focus on polling bias rather than COVID-19, and it only addresses the pandemic from the lens of its economic impact. Polls conducted on all adults will inevitably include the views of people that will not vote in the general election, which introduces biases regarding voter turnout. Pollsters attempt to mend this by strategically applying weights to the responses of individuals likely to vote, but this introduces another layer of bias unique to that pollster’s method. Over time, different pollsters will conduct surveys in the same areas, and The Economist’s model compares the results of these different polls on similar populations and adjusts for the differences. While polling biases certainly pose problems, FiveThirtyEight’s detailed handling of COVID-specific issues seems a bit more appropriate for the current circumstances. However, this is The Economist’s first statistical election forecast, so they could be considering the same measures as Nate Silver but neglected to include a lengthy description of it since they are not deviating from any precedent models. ↩
-
For each state’s turnout, I randomly drew a number from the normal distribution centered at the state’s 2016 voting-eligible population (VEP) with a standard deviation of 1.25 times the standard deviation of the VEP from 1980-2016. I multiplied the standard deviation by 1.25 since experts anticipate increased variation due to COVID-19. For the state model, I simulated 1,000 different elections for each state, with these different VEP values for each. For the national model, I ran 100,000 simulations using a randomly drawn number for the VEP in each. ↩
-
One shortfall of this method is that disparities in turnout are typically associated with subsets of the population more likely to vote for one party or another. These simulations altered the absolute number of voters in the election without correlation to a single party. ↩
-
All polling numbers used in this week come from FiveThirtyEight’s updating poll average from 3 weeks out from the election. ↩