2020 Presidential Election Analysis
Kayla Manning, Harvard College
Internet Advertisements in the 2020 Campaign
October 10, 2020
Role of Advertising in Political Campaigns
Political advertisements have powerful but short-lived effects,1 so advertisements closer to election day have the greatest likelihood of impacting election outcomes. Also, as a result of the Electoral College, campaigns must strategically buy advertisements in states that they consider crucial to the path to 270 votes. Keeping in mind the time considerations of campaigns and the importance of competitive states in electoral outcomes, this analysis will examine the past month’s online political advertising in battleground states.2
Social Media and Internet Advertising in Campaigns
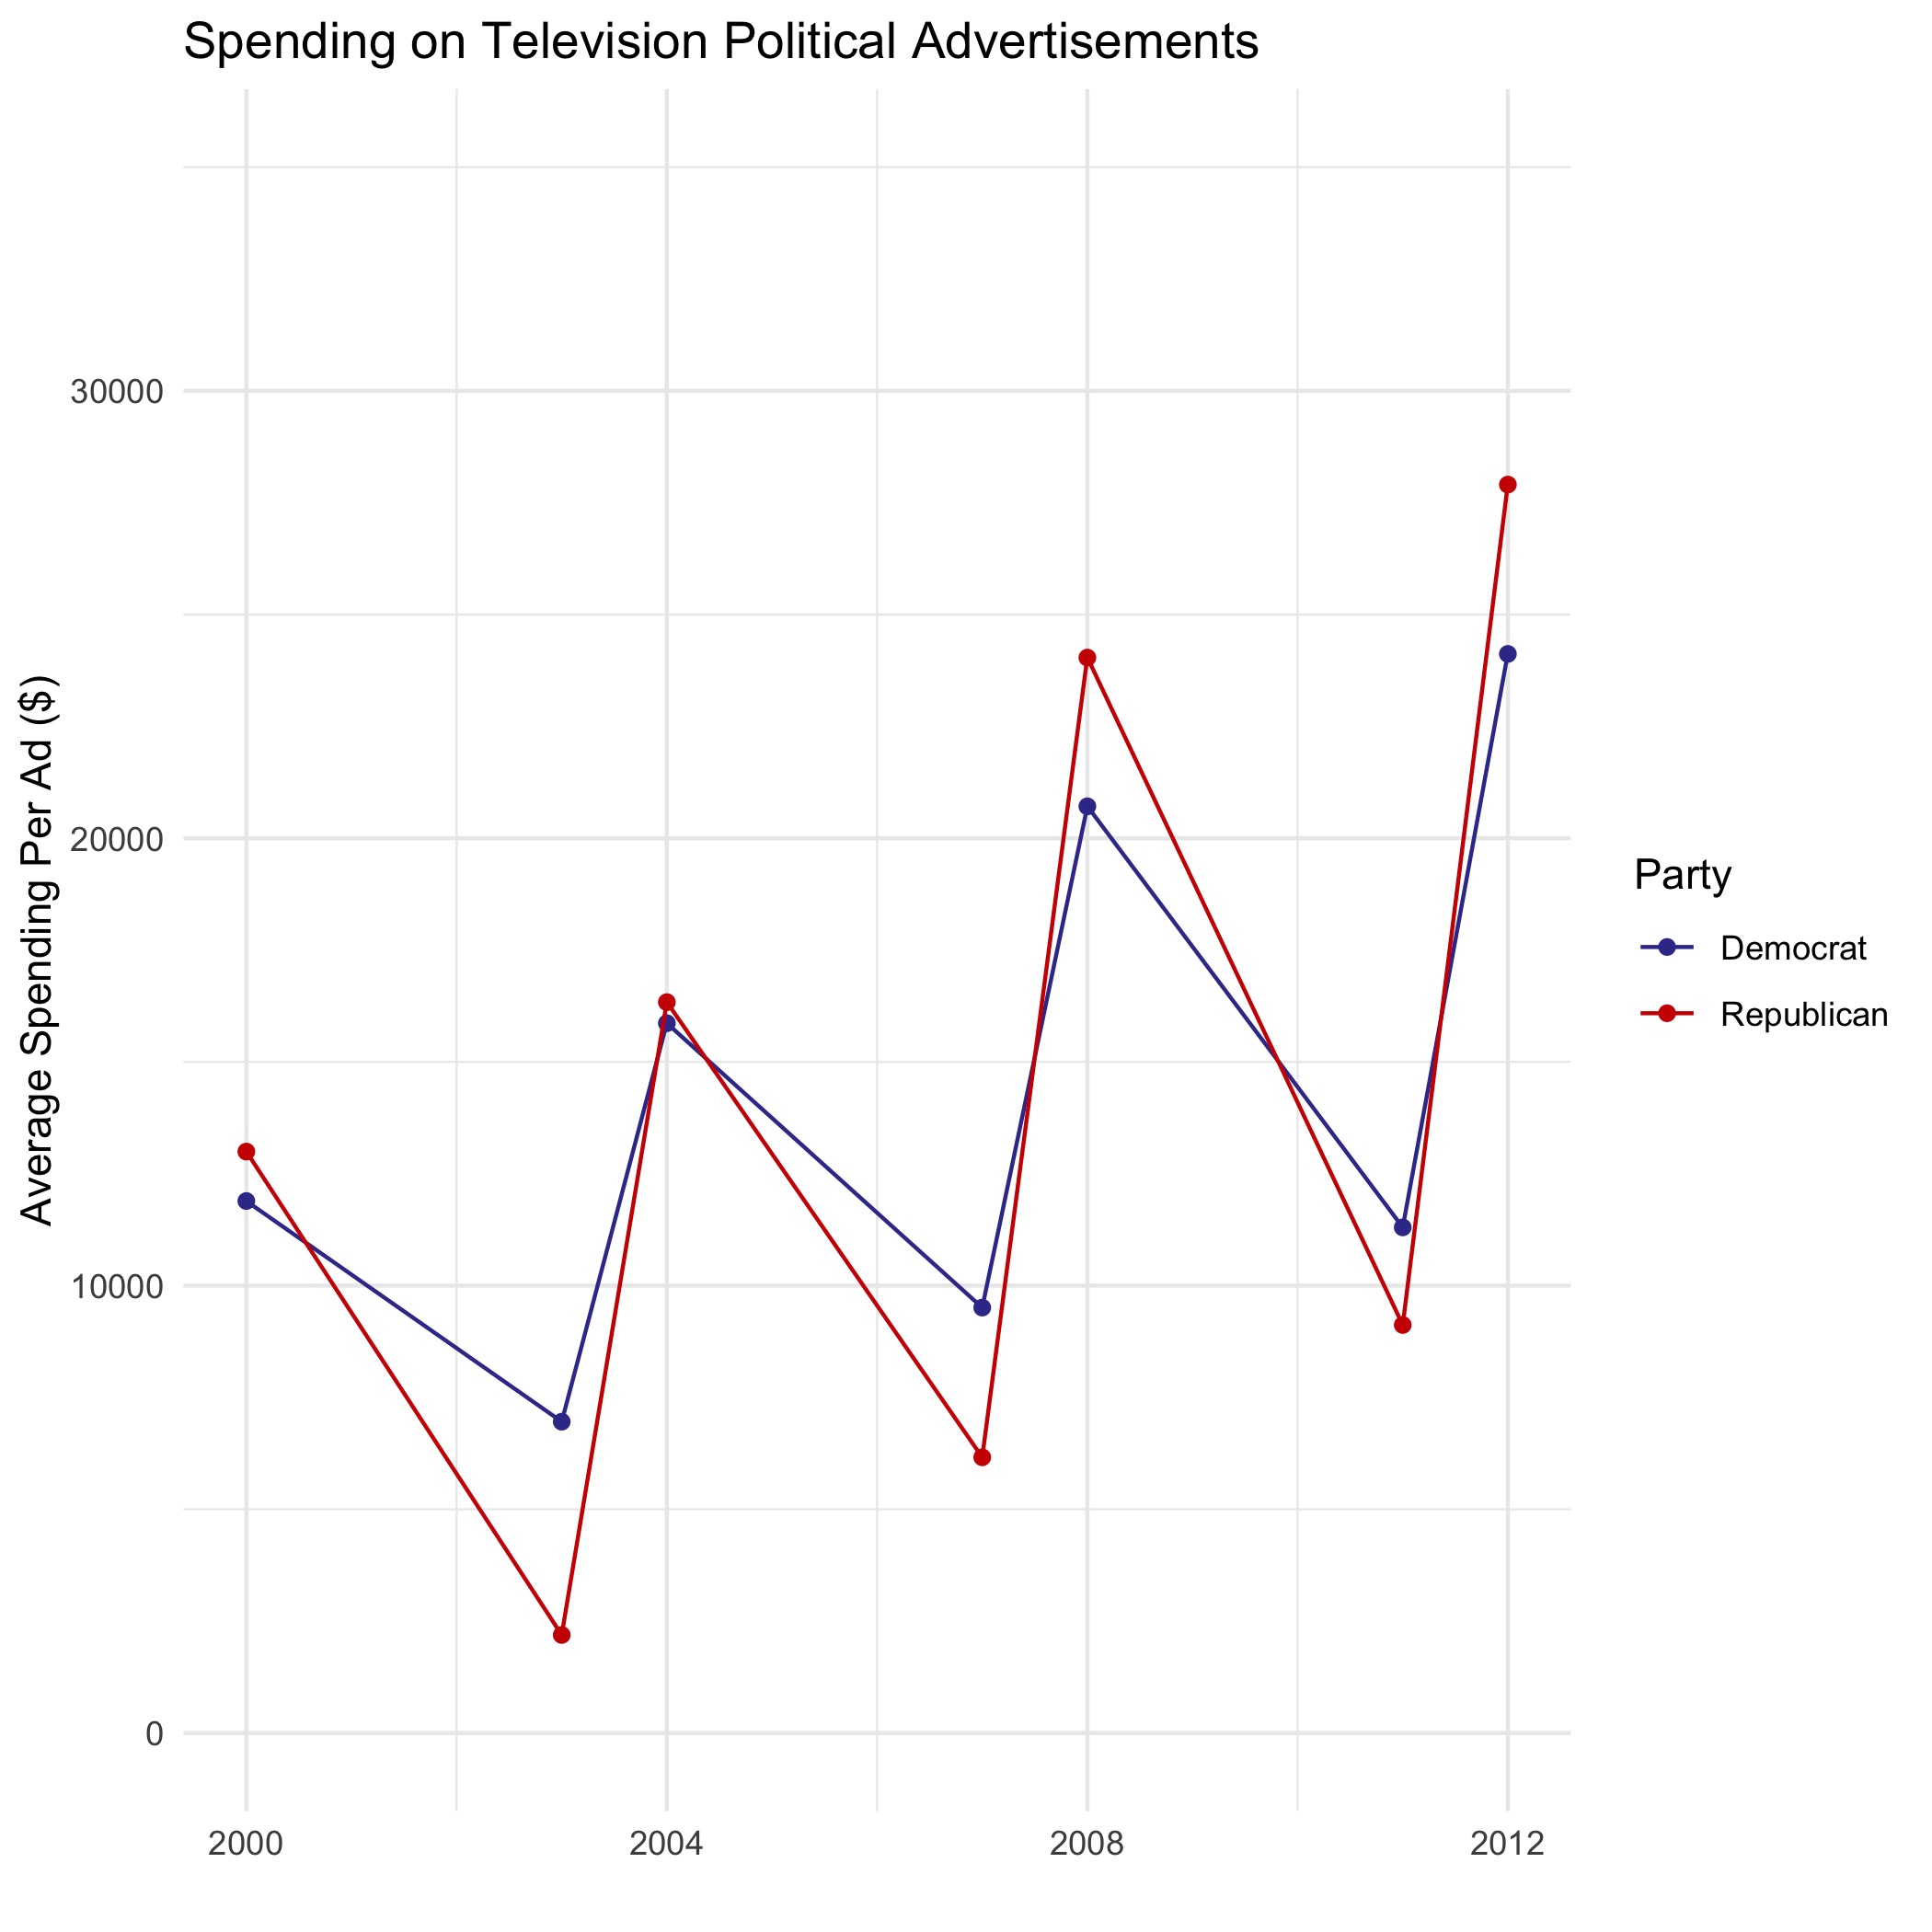
Over the past two decades, presidential campaigns have devoted increasing amounts of money to television advertising every election. Not only has television spending increased, but the advent of the internet and social media in recent years has also led to a sizable amount of money and attention devoted to these other forms of media.
The evolving digital landscape has played a key role in the shifting dynamics of presidential campaigns in recent years. Allegations of Russian interference in the 2016 election put social media at the forefront of the political stage. While the FBI’s investigation concluded that Russia did not alter any vote counts, they did use social media as a means to spread propaganda leading up to the election. Did social media actually change the 2016 outcome? Or do people just selectively consume content that reinforces their existing beliefs? The answers to these questions lie beyond the scope of this blog post; however, it does appear that candidates view advertising through these mediums as helpful since they devote sizable sums of money to advertising on Internet platforms such as Facebook and Google.
Facebook Advertising in 2020
The Facebook Ad Library contains data for advertisements about social issues, elections, and politics. While Donald Trump undoubtedly prefers Twitter as his platform of choice, he does not shy away from pouring sizable sums of money into Facebook advertisements:
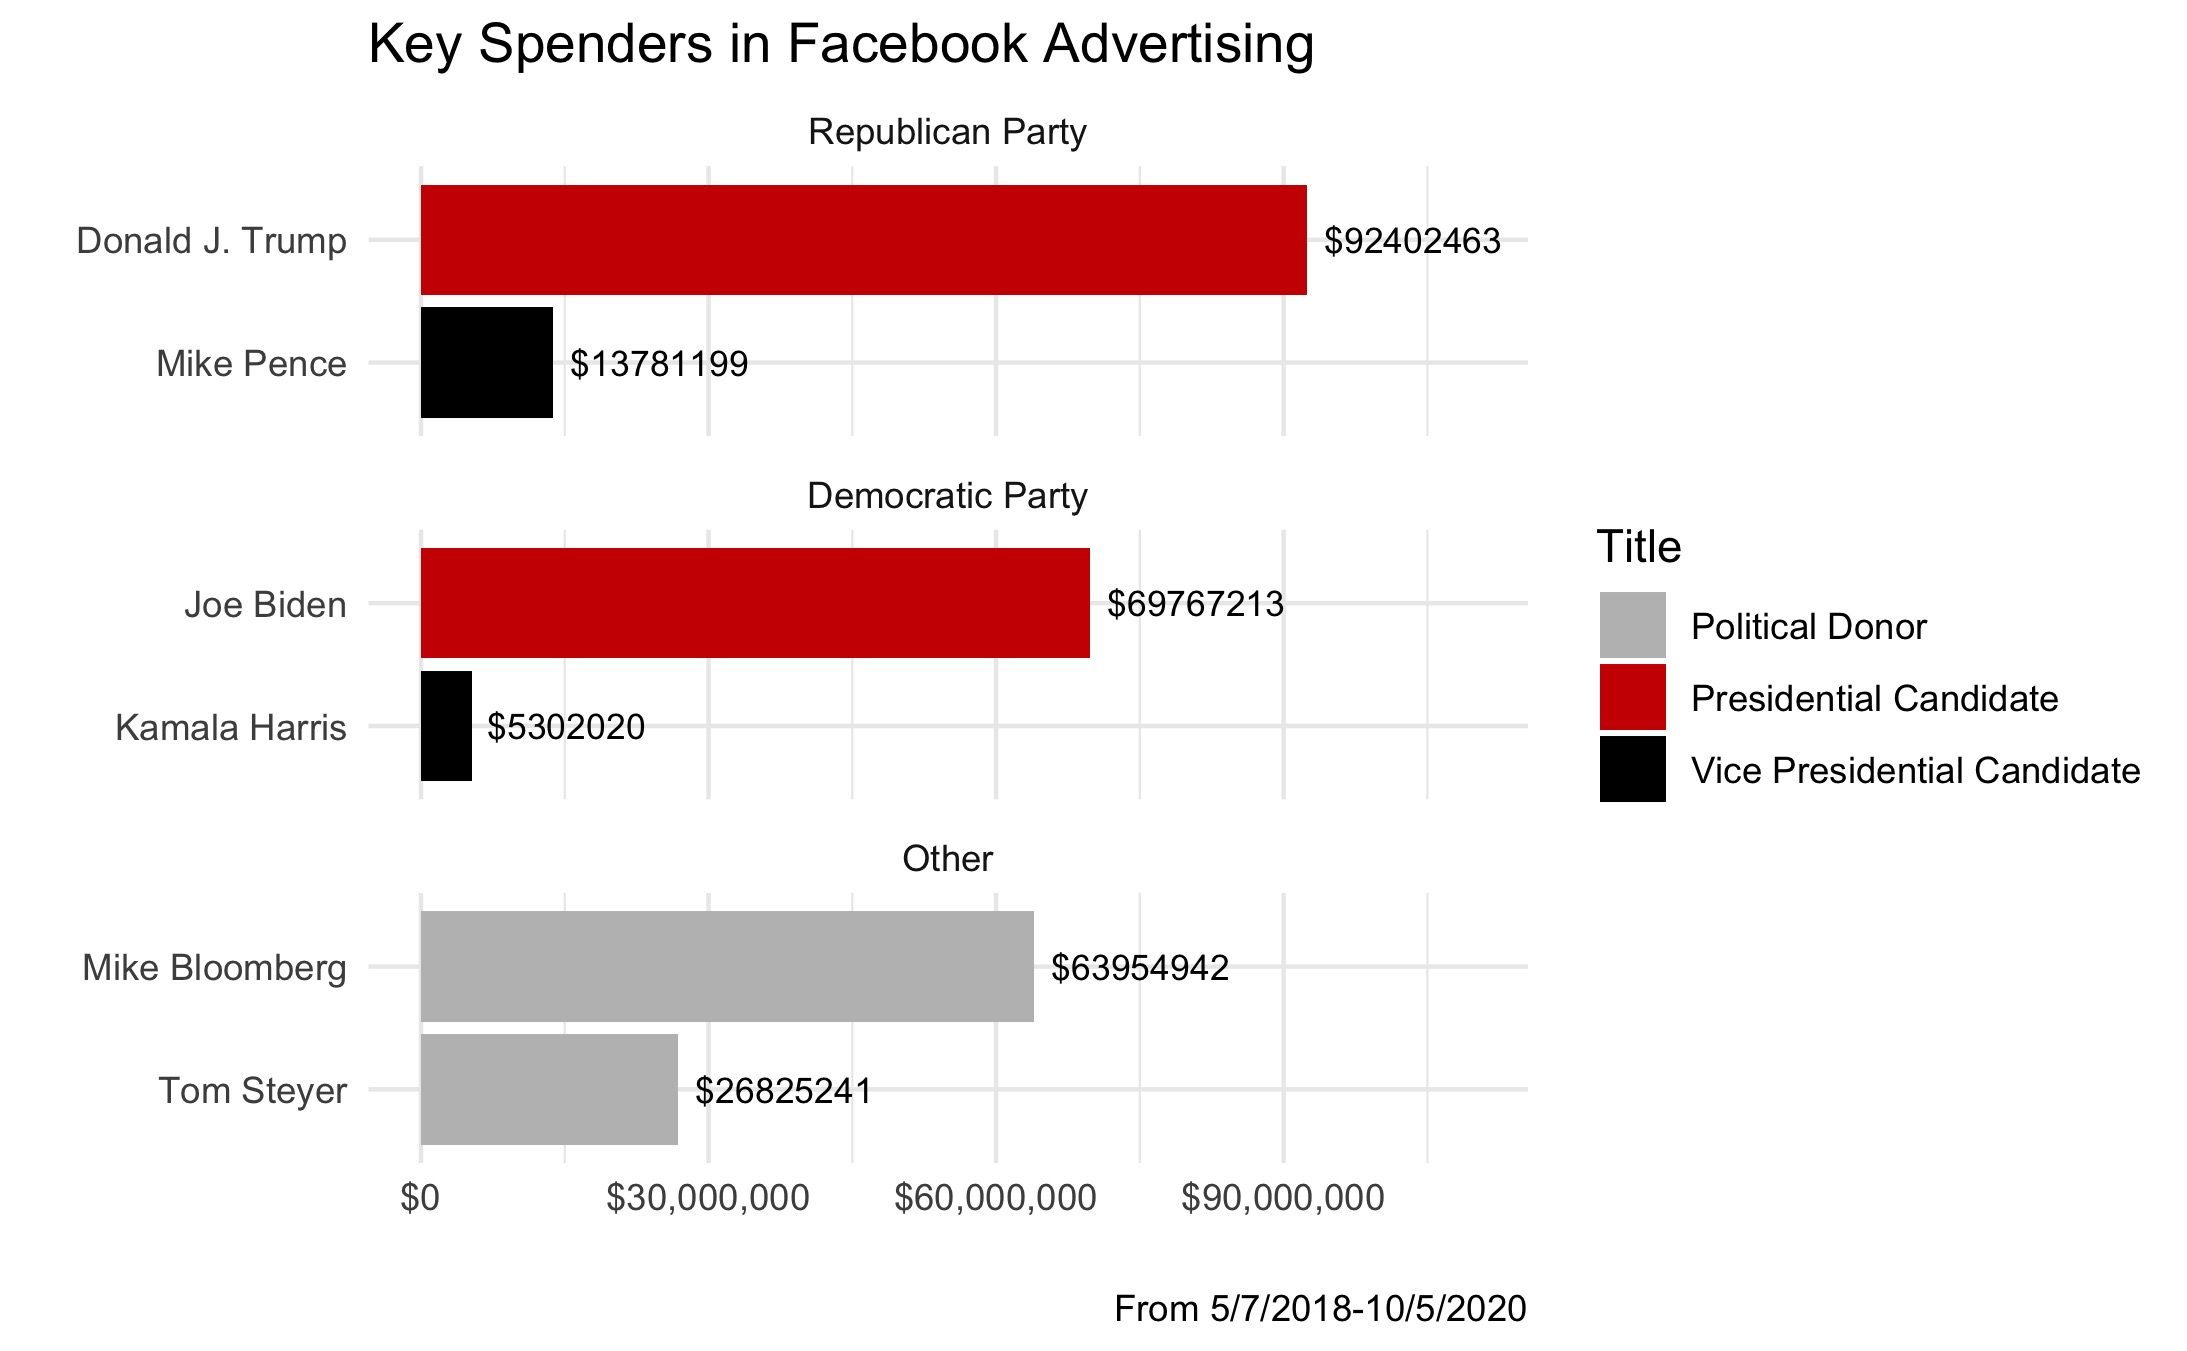
Not surprisingly, the major party candidates rank as the top political advertisers on Facebook, with their running mates trailing behind. One aspect of the incumbent advantage is that Donald Trump began his campaign far earlier than Biden, and the greater spending on advertisements over the past two years is one manifestation of that. Interestingly, two key players both paid more for Facebook ads in the past 30 days than the vice-presidential candidates: Mike Bloomberg and Tom Steyer. Mike Bloomberg famously spent over $1 billion during his brief four-month bid for the Democratic primary, and he has continued to direct substantial funds to help further the Democratic cause. Tom Steyer, the billionaire philanthropist and another contender in the Democratic primary, has also made massive investments in Facebook advertisements over the past couple of years.
While Trump has invested the most money in Facebook advertisements over the past two years, Joe Biden has outspent Donald Trump in many key swing states in the past month:
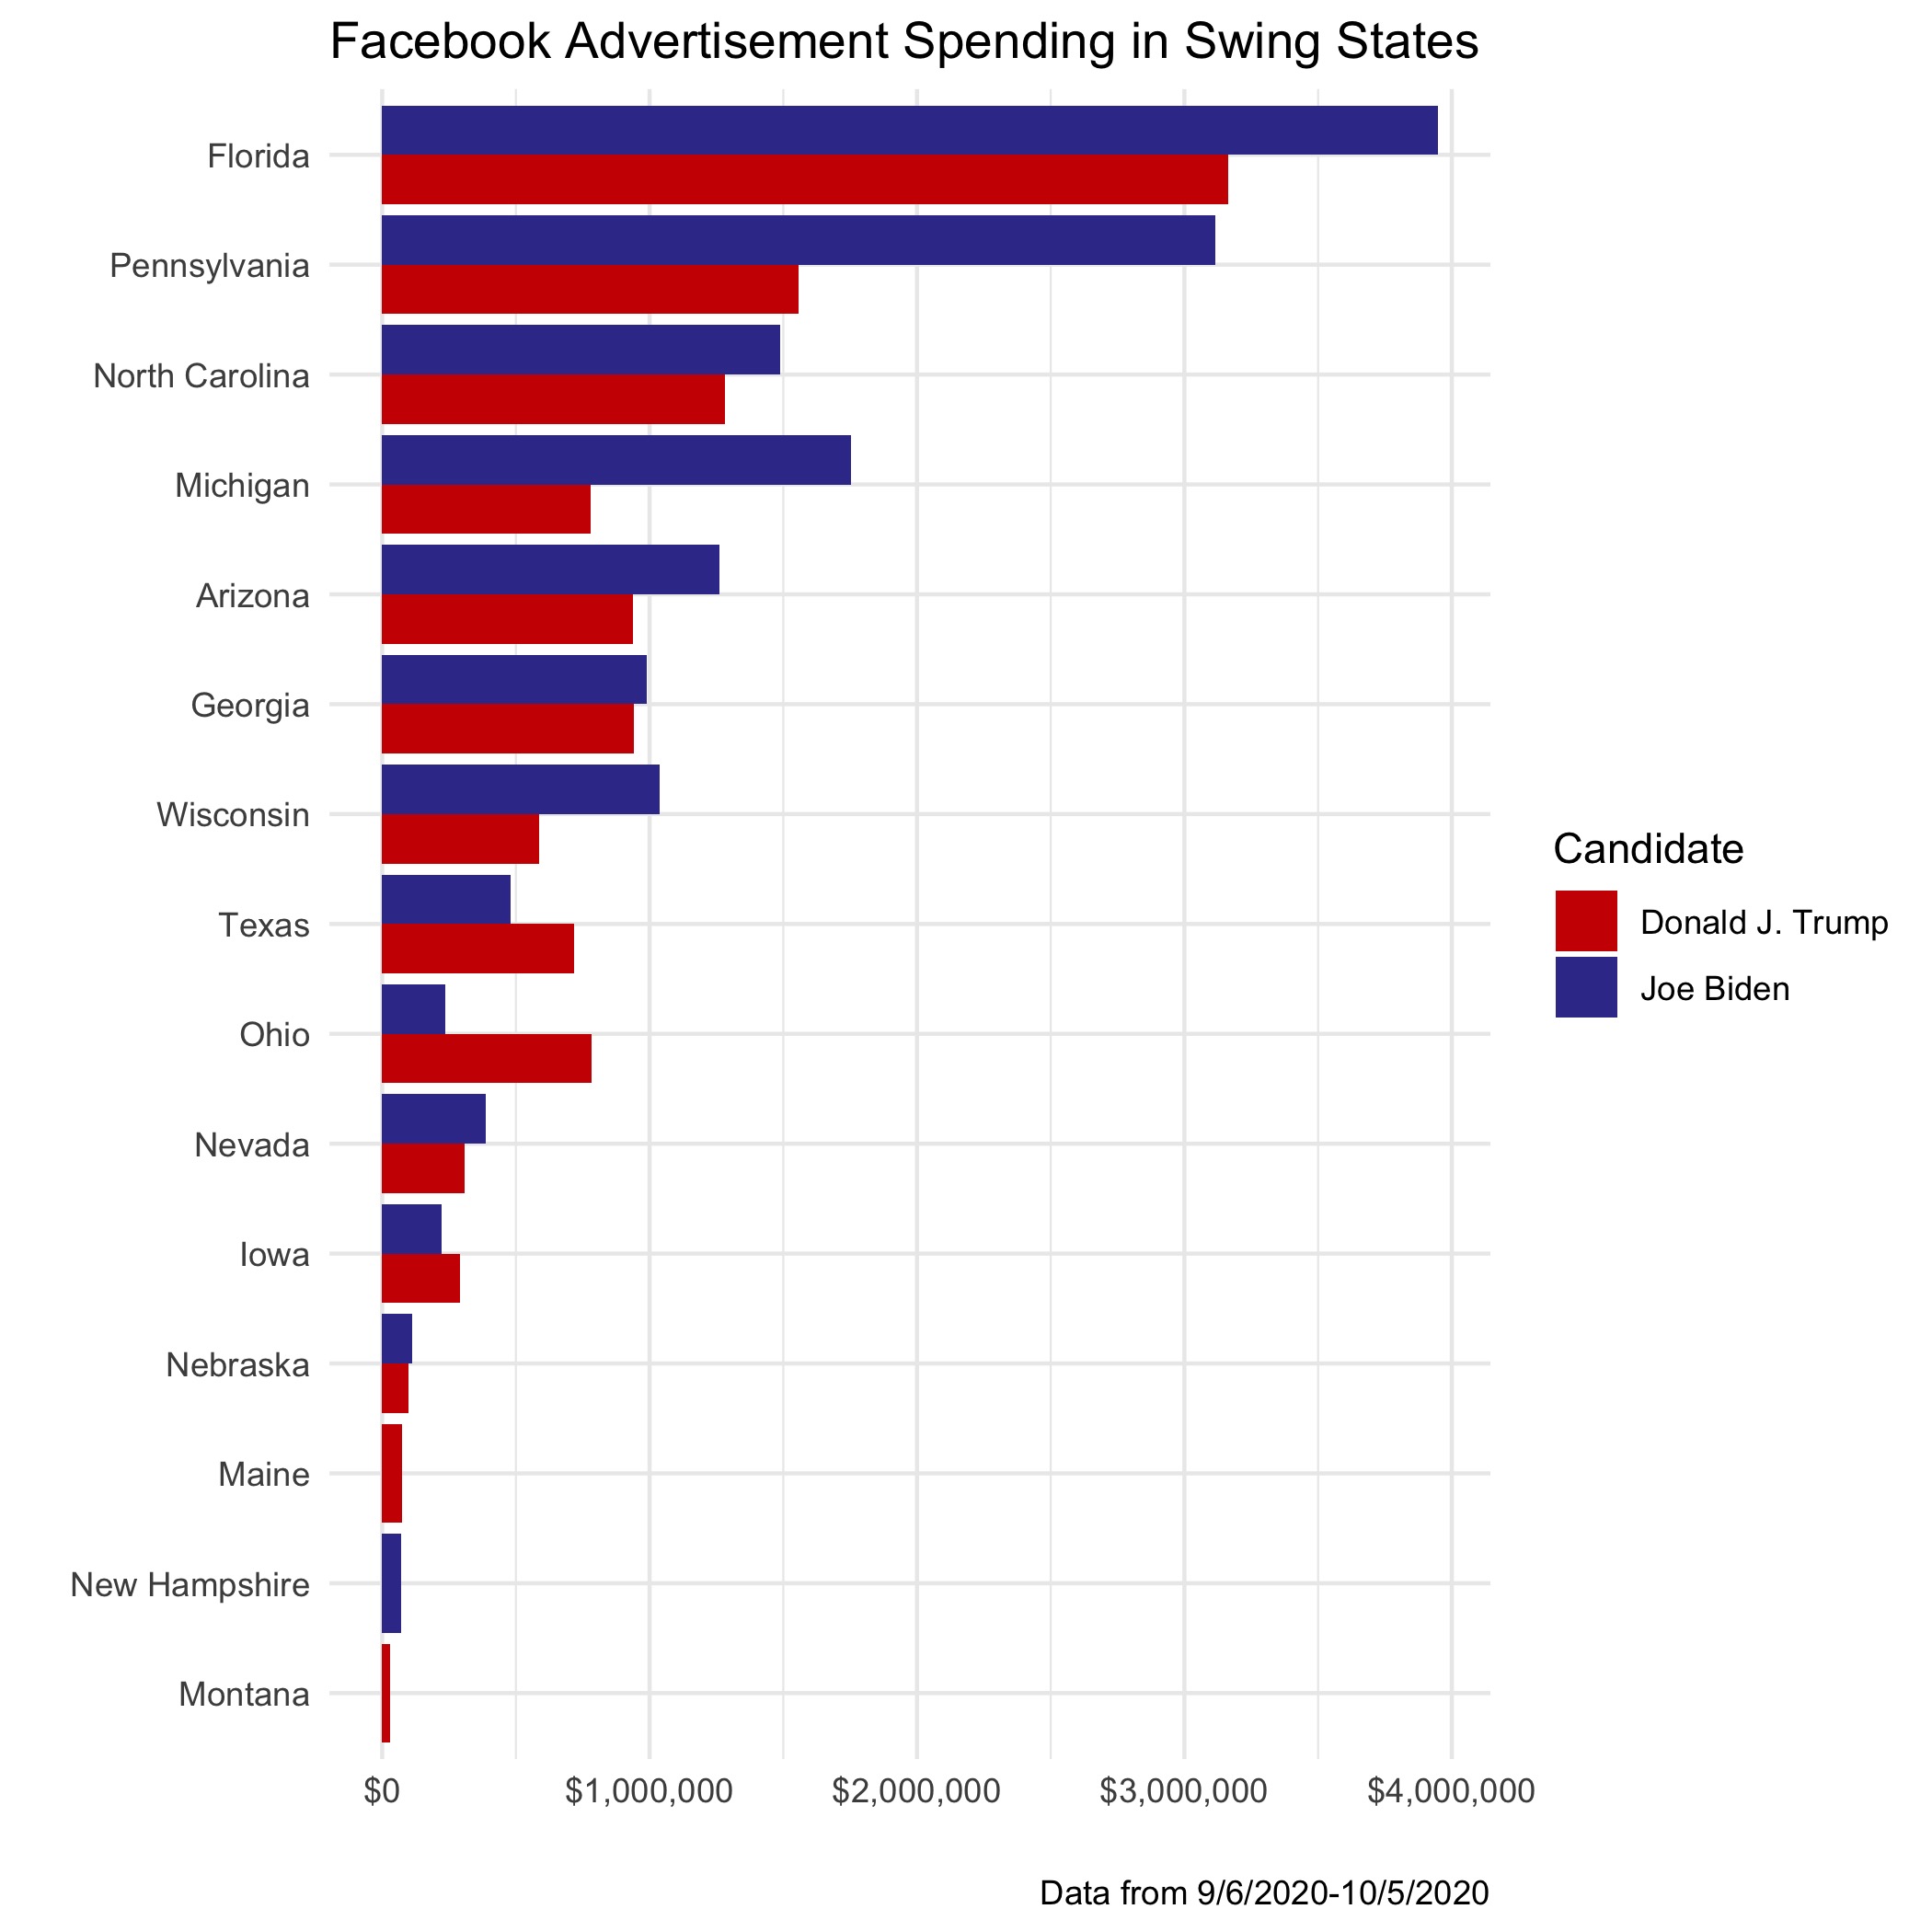
Since research supports that the effects of political advertising diminish quickly,1 Biden’s strategic spending in swing states on the tail-end of the campaign may work to his advantage more than if he had spread that spending across the country throughout the campaign.
Google Advertising in 2020
Google’s Transparency Report provides data on political advertising on Google, YouTube, and other partner properties. The below figure compares the relative advertising3 numbers on Facebook, TV, and Google4 across battleground states. Blue indicates either greater ad volume or spending by Joe Biden relative to Donald Trump, and red indicates greater advertising volume or spending by Trump relative to Biden:
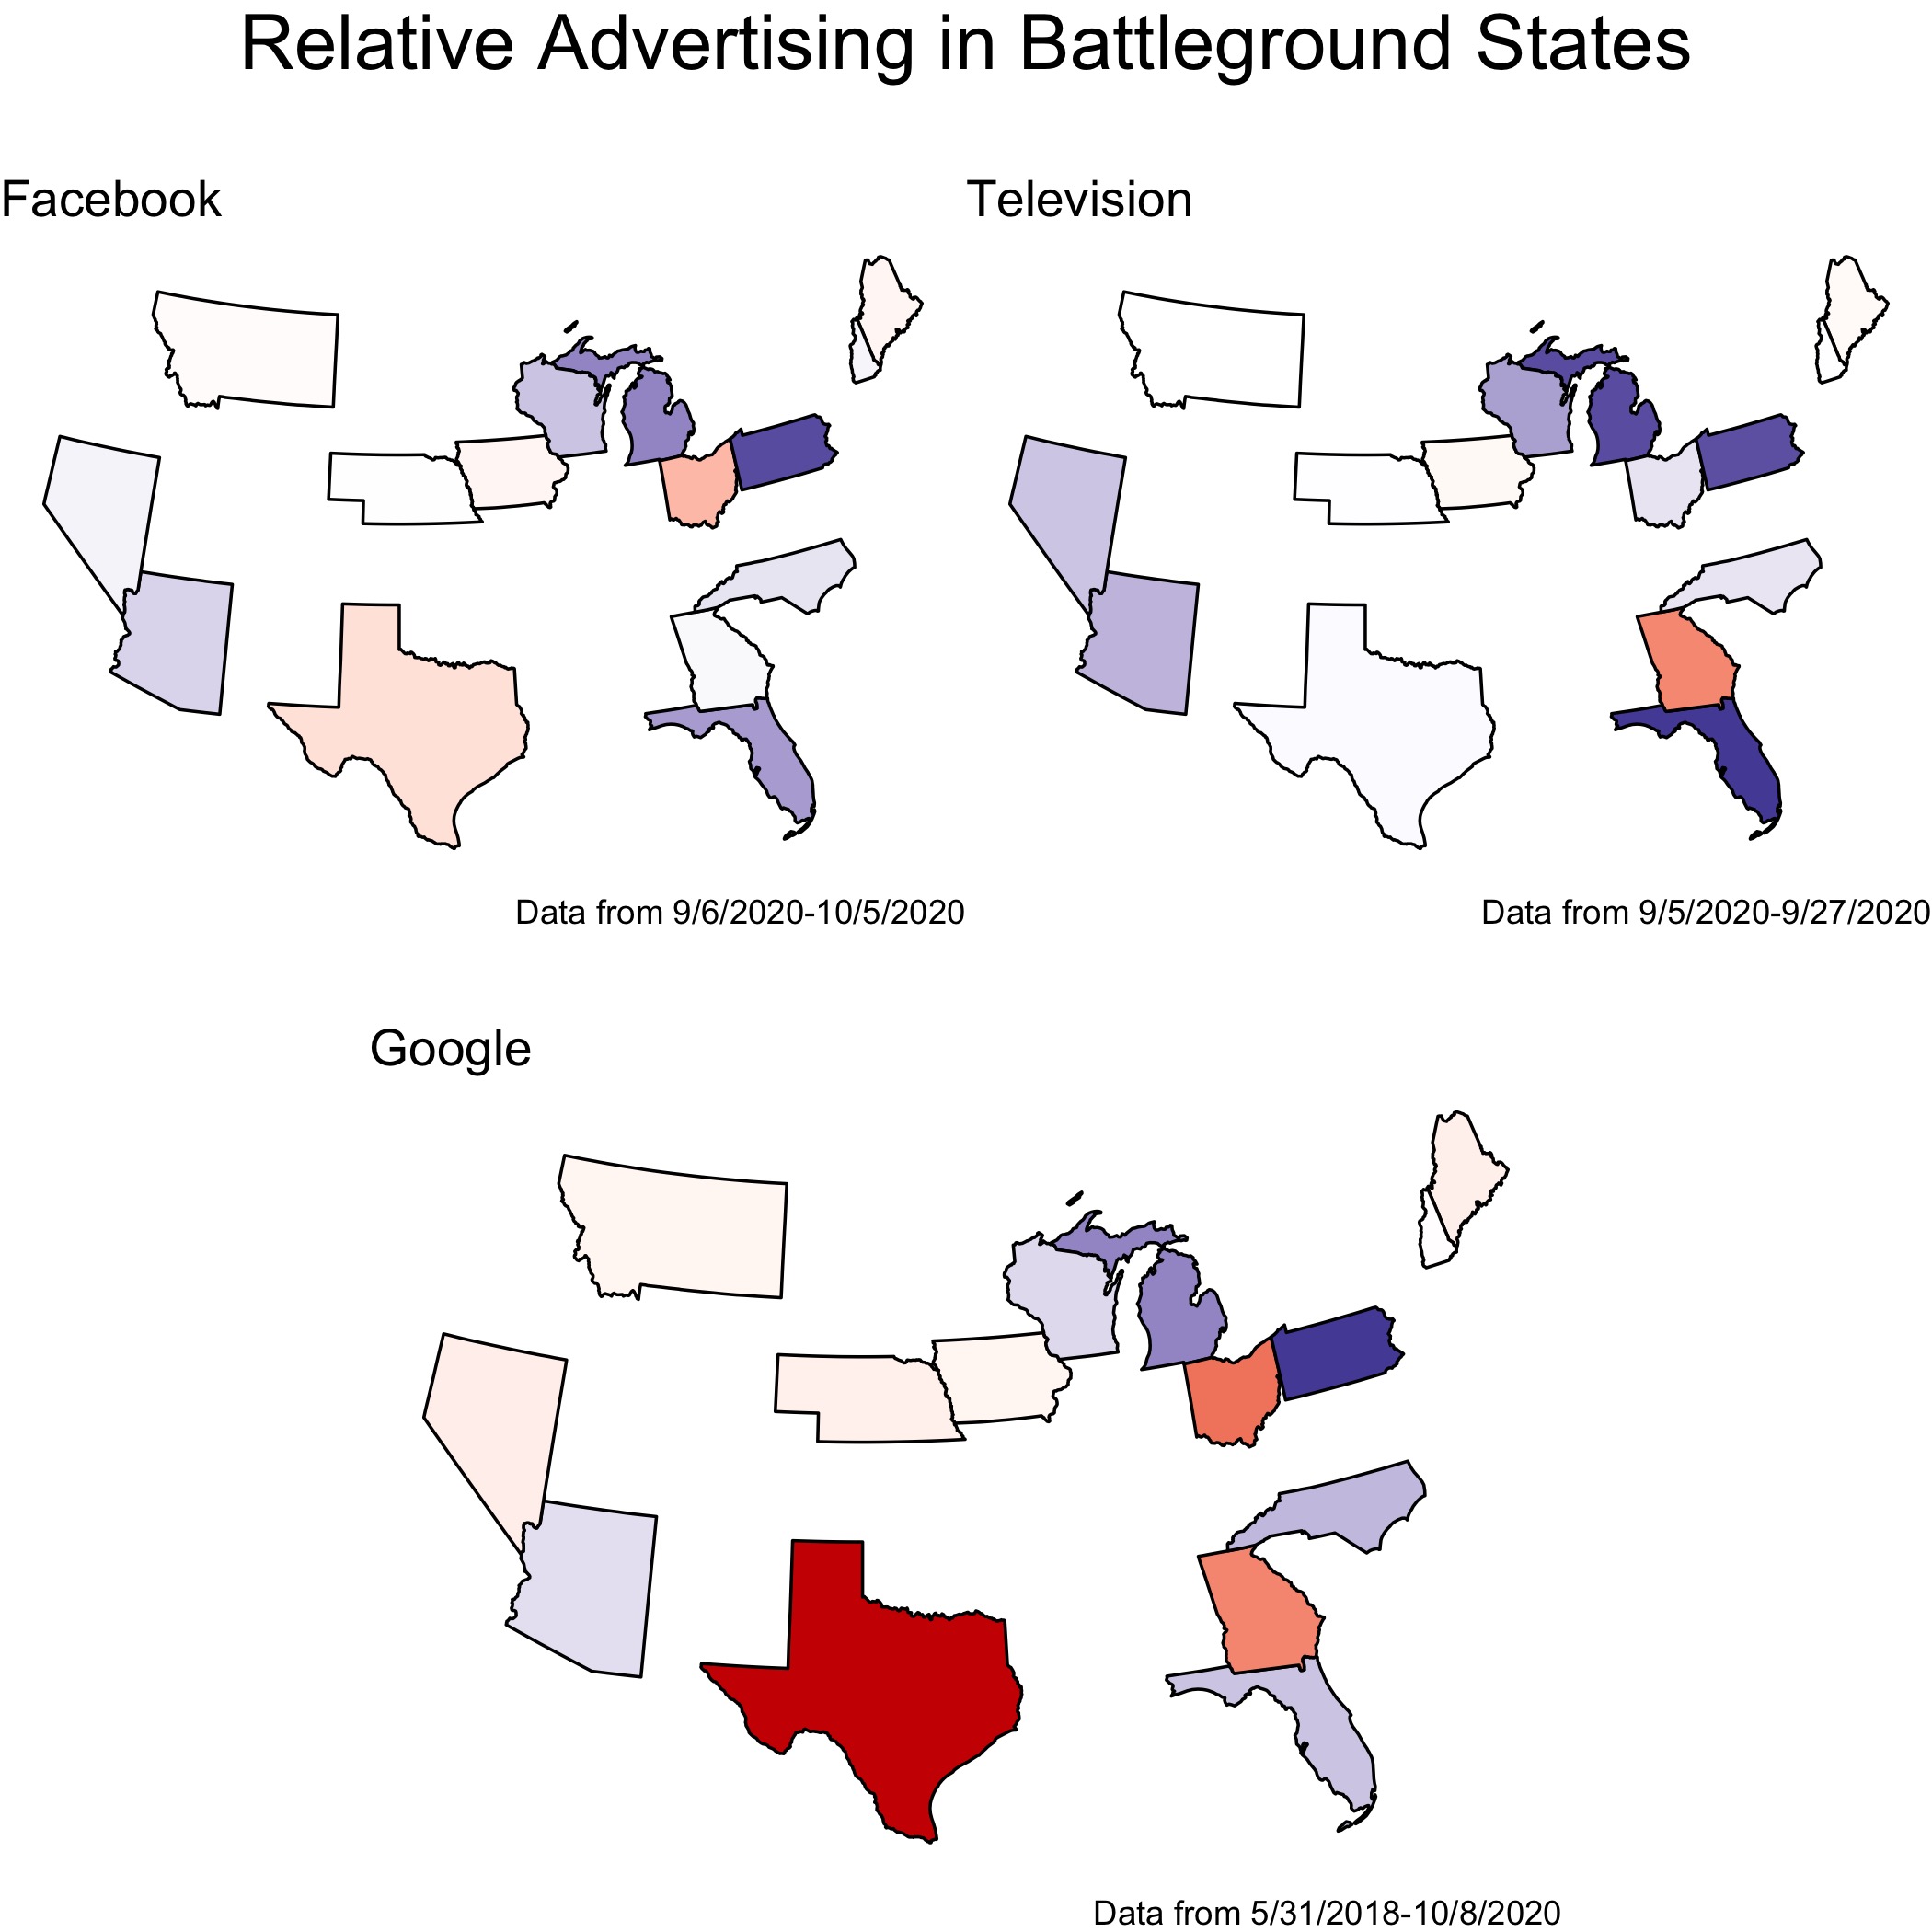
The candidates appear to devote attention to states at similar margins across the platforms, with Ohio, Nevada, Texas, and Georgia as the only states that vary substantially in partisan advertising margins across platforms. Donald Trump exceeded Biden’s number of Google ads in Texas by a much greater margin than he did on other platforms in Texas. On the other hand, Biden beat Trump by a greater margin in Florida TV ads than in other advertising platforms in the same state.
What does this mean?
While political advertising does little to inform and mobilize voters, they do have persuasive effects.5 What could the candidates in 2020 hope to gain from their advertising initiatives? Despite dominating Donald Trump in the air war in 2016, Hillary Clinton failed to secure a victory.6 More recently, Michael Bloomberg’s campaign showed that advertising alone cannot significantly alter the course of an election.
Most previous studies examine the possible effects of television advertising, which is still relevant. However, as we see in the data, many candidates have also devoted large sums of money to online advertising in recent years. Do online advertisements have the same effect? Or, perhaps, are they less salient due to the ability to scroll immediately past them?
My most successful model7 thus far has not used advertising as a predictor. To visualize how the predictions of this model differ from the candidates’ relative ad strategies, I created a model using those variables for each state and predicted the winner of the two-party popular vote. One would think that candidates may aim to flood swing states leaning slightly toward the other party with advertisements in an attempt to win them over. However, this model, despite not including advertising data, has most states voting for the candidate that is advertising more heavily:
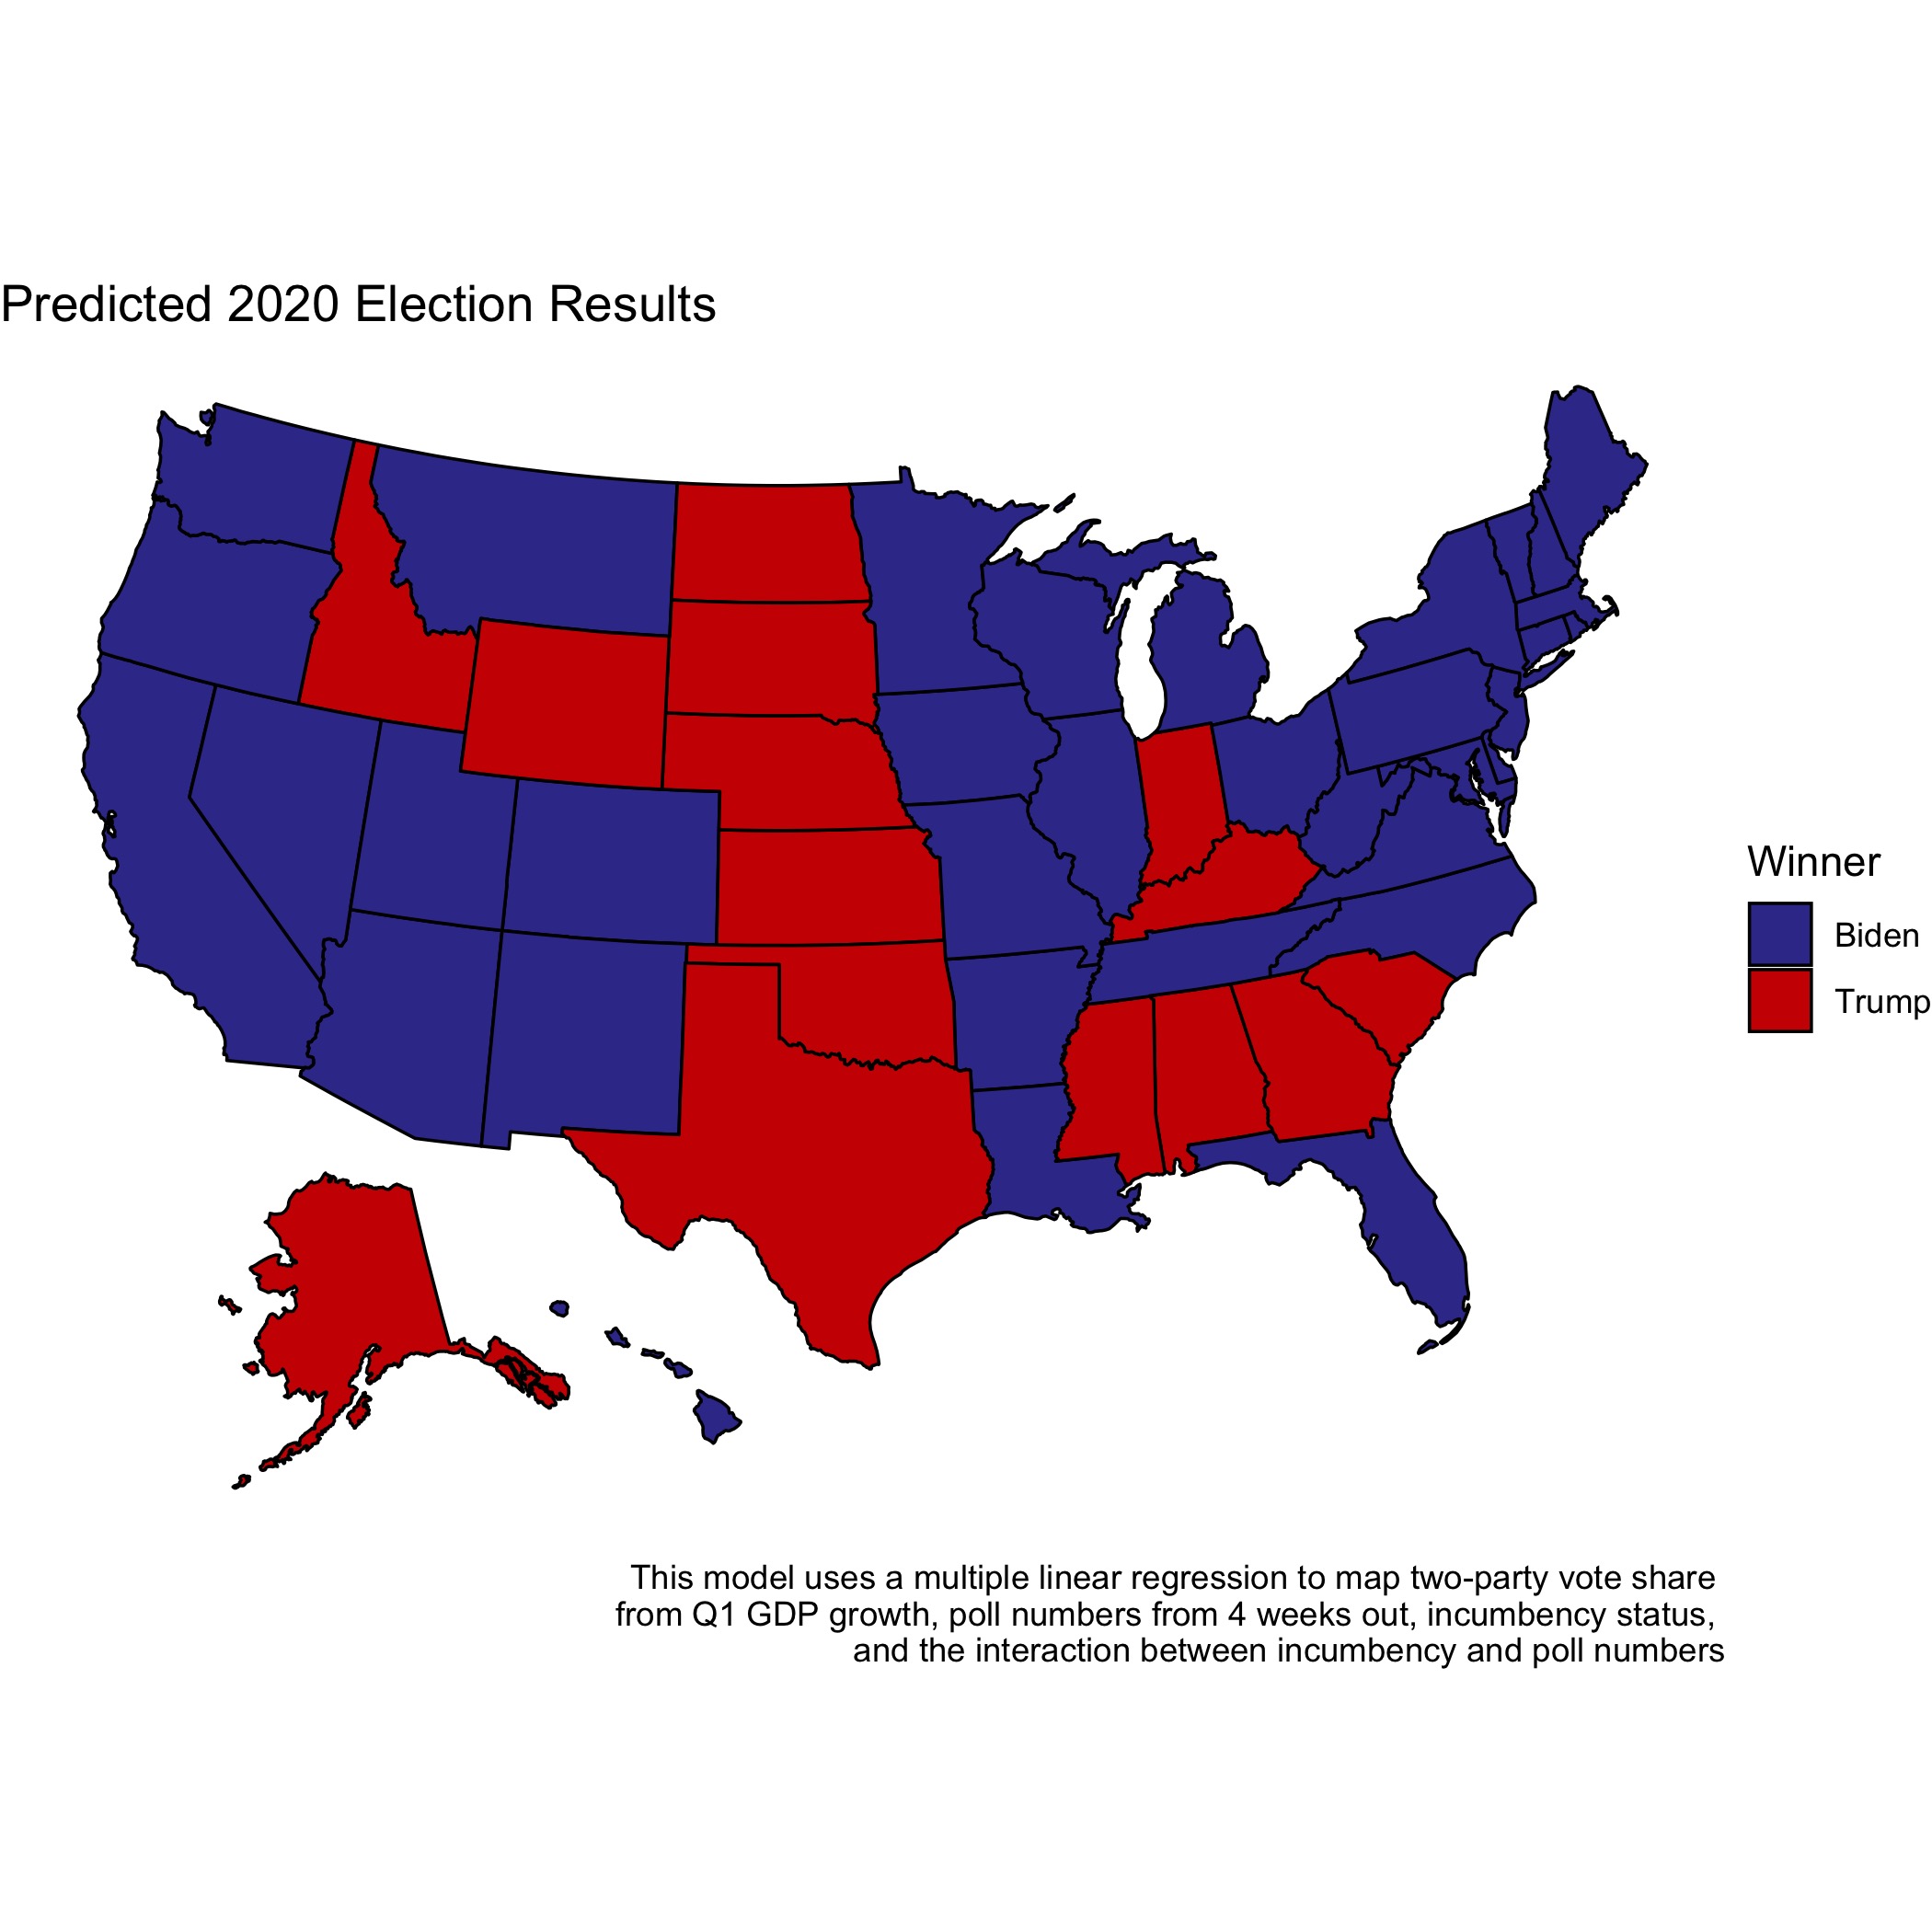
Most battleground states appear to match the color of the relative ad spending maps, indicating that candidates may not be aiming to flip states that are out of reach, but instead maintain narrow projected leads in these competitive states. However, this model is far from complete and is not meant to serve as a definitive prediction for the election, but rather to visualize of a potential outcome modeled from economic, polling, and incumbency data.8
While scholars dispute the role of advertising in election outcomes, next week’s post will examine the role of field campaigning in elections and how it may differ from advertising. In the meantime, it is an interesting thought exercise to ponder the motivations behind and potential impact of each candidate’s advertising strategy as touched on by this blog post.
-
[Gerber et al., 2011] Gerber, A. S., Gimpel, J. G., Green, D. P., and Shaw, D. R. (2011). How Large and Long-lasting are the Persuasive Effects of Televised Campaign Ads? Results from a Randomized Field Experiment.American Political Science Review, 105(01):135–150. ↩ ↩2
-
While I previously constructed my personal definition of battleground states, this analysis focuses on the states that the New York Times classifies as competitive in this interactive model for the 2020 election. ↩
-
These maps are generated by taking the difference between Joe Biden’s ad spending or count and Donald Trump’s ad spending or count. The different platforms used different metrics in the data, which is why I could not use a common legend or the same units for all of the maps. To generate these plots, I took the difference between Joe Biden’s and Donald Trump’s advertisement count or advertising spending (depending on what was available in the data) and plotted those differences. Positive numbers are darker blue, indicating that Joe Biden has outspent/advertised Trump in that state, negative numbers are darker red, indicating that Trump outspent/advertised Biden in that state, and near-zero numbers are white, indicating that the candidates devoted about the same amount of advertising spending or the same number of advertisements in that state. While I cannot offer a common axis for the three plots since some maps have differences in spending and some have differences in ad count, the maps help the reader visualize which candidate is advertising at a greater margin within that state. ↩
-
Google’s data begins on 5/31/2018 and did not have dates as a variable in the dataset, so it is important to consider that the Google map does not isolate how candidates have allocated their advertising efforts in the past month. ↩
-
[Huber and Arceneaux, 2007] Huber, G. A. and Arceneaux, K. (2007). Identifying the Persuasive Effects of Presidential Advertising. American Journal of Political Science, 51(4):957–977. ↩
-
While Clinton failed to win the election, she did secure a victory in the popular vote. However, most campaign advertising happens in swing states to help win an Electoral College victory, which Clinton failed to do. ↩
-
Variants of this model are featured as Model 3 in the Economy post, my regression in the Polling post, and my regression in the Incumbency post. ↩
-
In the coming weeks, I hope to improve this model by accounting for more variation and converting it to a probabilistic model. Currently, the two-party vote sums for each candidate do not sum exactly to 100% for each state. This does not pose any major problems for this simple visualization–I simply colored the states for the candidate predicted to win a greater vote share. However, I would like to constrain the sum of the predictions to 100% before I make any electoral predictions using these state-by-state models. In addition to that modification, I would also like to incorporate uncertainty by simulating the election a large number of times, predicting each state’s winner from those simulations, and providing a level of confidence for each prediction. ↩