2020 Presidential Election Analysis
Kayla Manning, Harvard College
Polling and Presidential Elections
September 26, 2020
Polls and Presidential Elections
Last week’s blog post revealed that a economics-only model yields unrealistic results for the 2020 election due to the economic tumult of the past 9 months. However, incorporating additional variables, such as approval numbers or polls, helps capture a more well-rounded snapshot of electoral possibilities.
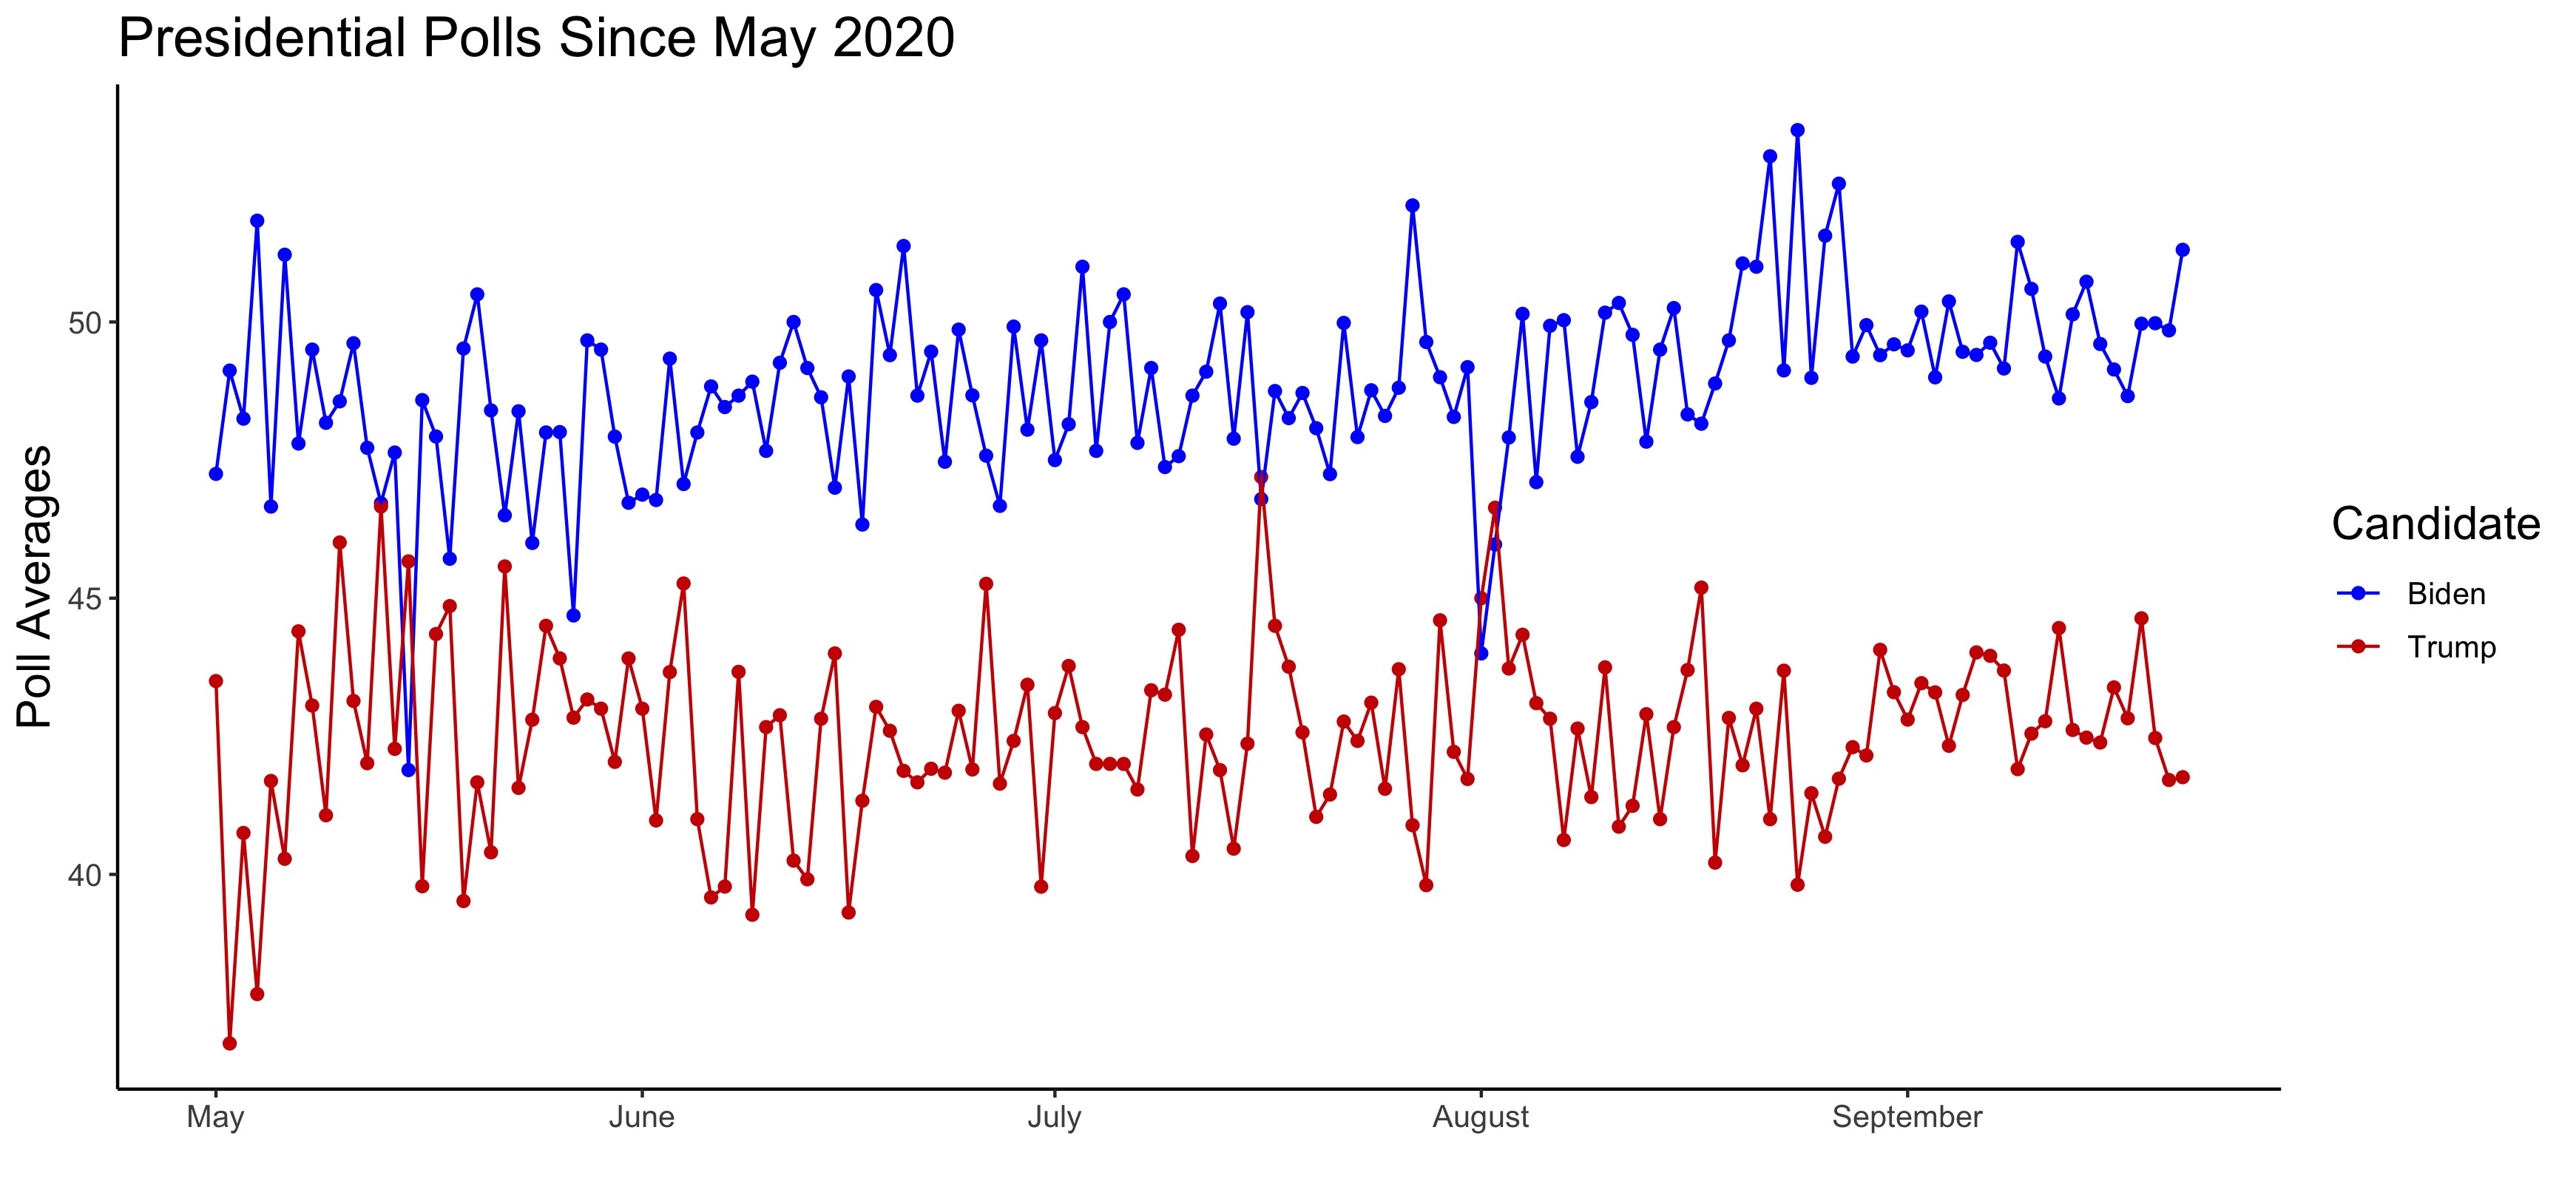
Polls in the first half of election years often serve as weak predictors for November outcomes, but polls ultimately converge to the election outcome as Election Day approaches. Political scientists theorize that this convergence of numbers occurs due to voters reaching their enlightened opinions1, and a quick look at the polling numbers since May 2020, when Joe Biden became the presumptive Democratic nominee, confirm this notion as the numbers begin to stabilize in September:

Building off of Economy Model 3
Following last week’s lead, I began my quest to construct an improved model by building upon Model 3, a multivariate model predicting the incumbent party’s two-party vote share from Q1 GDP growth, Q3 job approval numbers, incumbency status, and the interactions between incumbency and Q1 GDP growth and Q3 job approval numbers.
To begin, I replaced Q3 job approval numbers with presidential polling averages. This adjustment brought the adjusted r-squared to 0.966, meaning that the model fit the data strikingly well. However, this also put the model at risk for overfitting the historical data and performing poorly out-of-sample. To amend this, I removed the interaction term between incumbency and Q1 GDP growth (but kept it for incumbency and average support), which lowered the adjusted r-squared to 0.910 but improved the out-of-sample fit. This new model successfully classified two-party popular vote victories in 84.6% of the post-WWII elections when performing leave-one-out cross validation.
Last week’s model predicted the two-party vote share for the incumbent party, which poses an issue if I wish to apply it to both candidates. While I could still estimate Trump’s predicted vote share with this model, it would not accurately estimate Biden’s vote share since it was only fit with data from the incumbent party. To maintain a consistent approach for both candidates, I elected to fit a model with data from both parties.
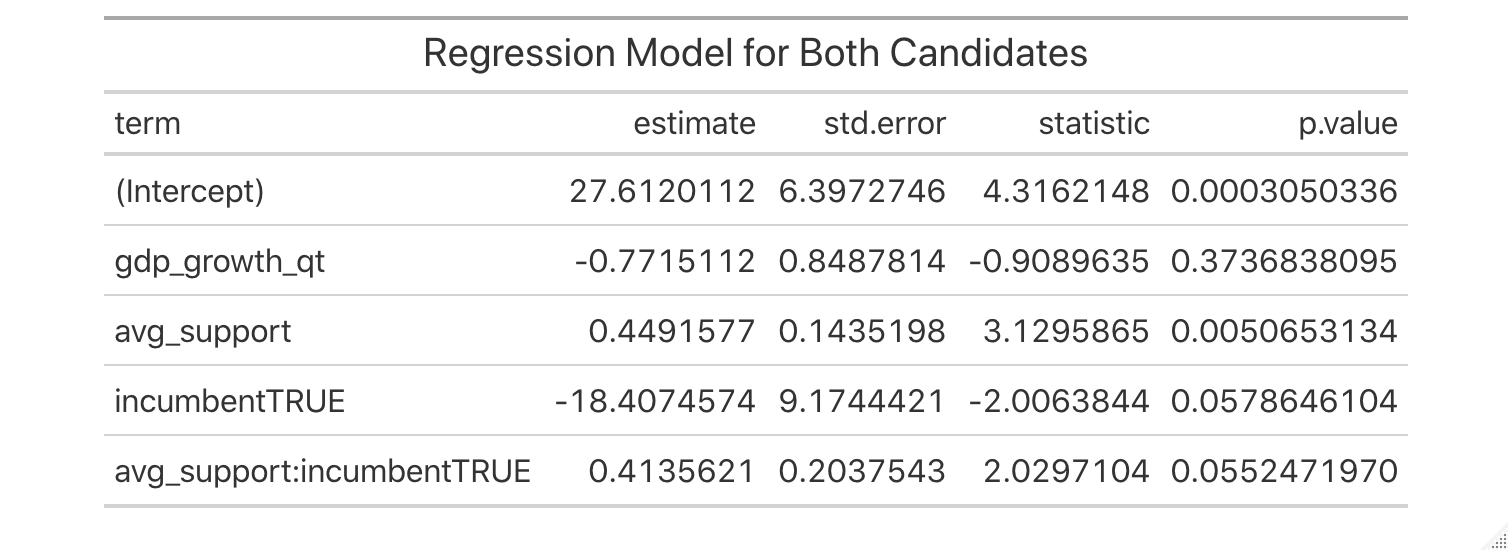
To construct a model for both candidates, I removed the incumbent party filter from last week’s Model 3, incorporated historical polling numbers in the place of Q3 job approval, and removed the interaction term between incumbency and Q1 GDP growth. Also, since the polls account for undecided and third-party voters, I constructed this model to predict the overall popular vote share of the two major candidates instead of the two-party vote share:

This new model has an adjusted r-squared of 0.688 and correctly classified 84.6% of the past elections in leave-one-out cross validation. When put to the test with 2020 numbers for the respective candidates, the model predicted that Biden would win approximately 51.2% of the popular vote and Trump would earn 47.6% of the popular vote.
Predictions from 2020 Polls Based on 2016 Performance
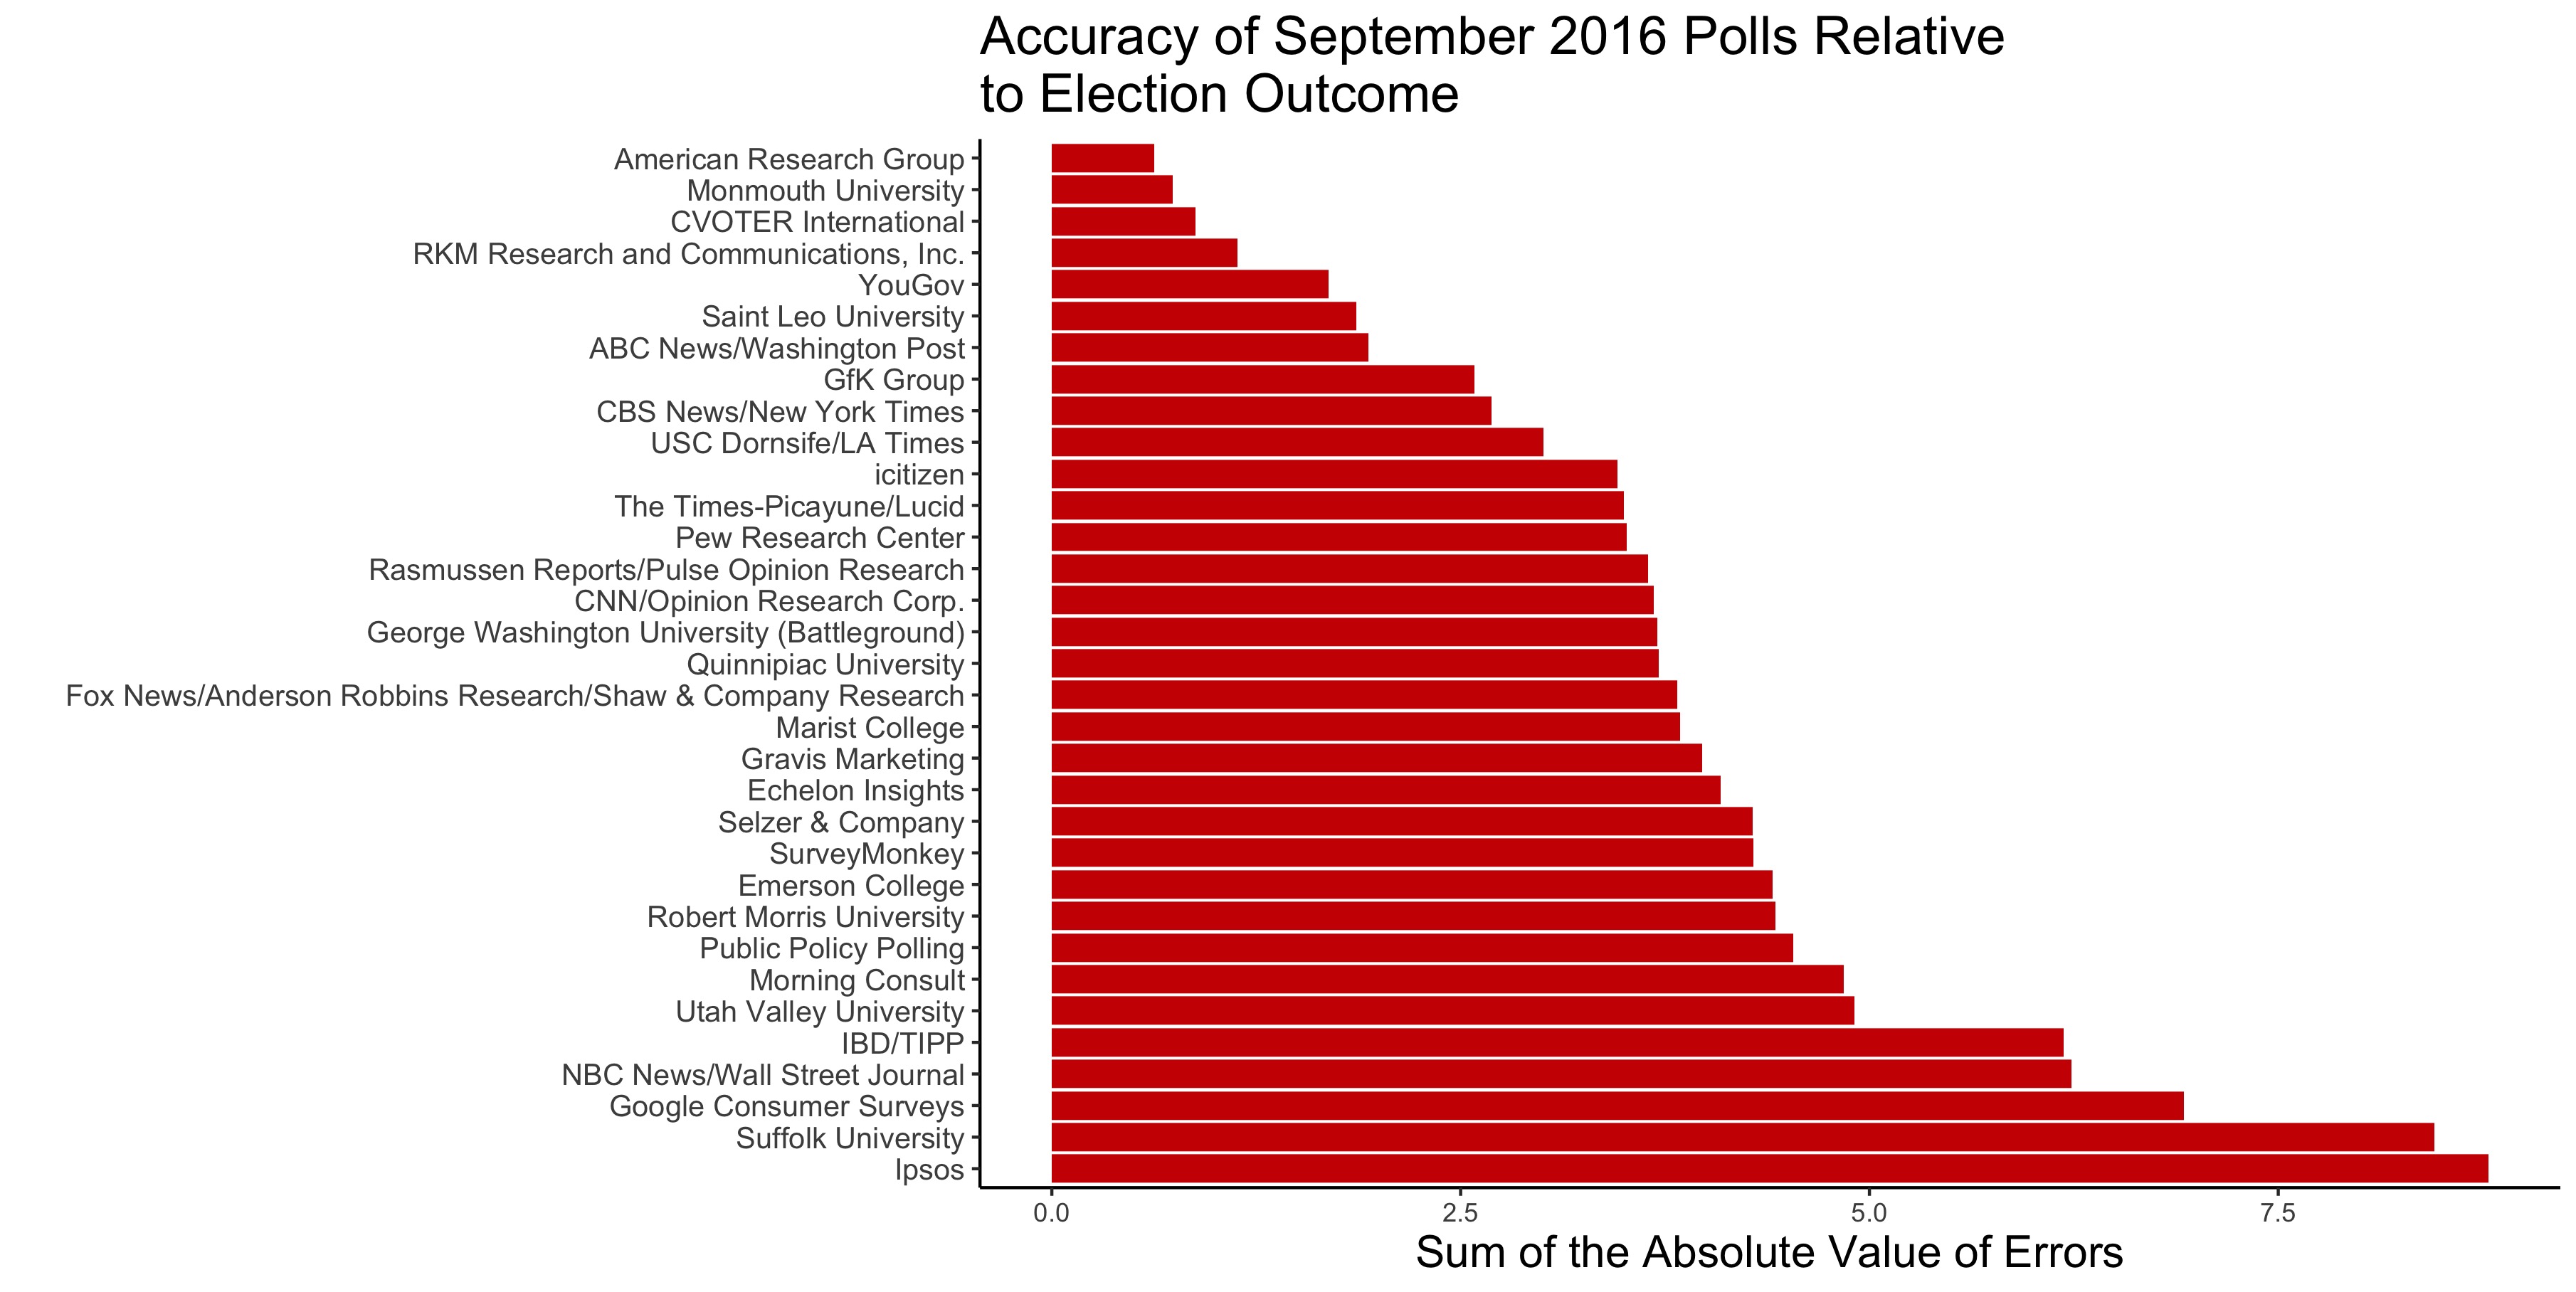
As mentioned in the introduction, polls generally serve as a helpful indicator for the electorate’s positions on candidates, but some polls make better predictions than others. FiveThirtyEight has compiled data on pollster ratings that account for bias and errors. Below, Figure 3 displays the sums of the absolute value of errors2 for Clinton and Trump’s vote shares from various September 2016 polls:

To supplement my regression model, I compiled another set of predictions by weighing3 September 2020 pollster numbers relative to their accuracy in September 2016. Applying greater weights to more accurate polls from September 2016 yields predicted vote shares of approximately 50.7% for Joe Biden and 42.7% for Donald Trump4.
Combining Models
Drawing inspiration from this week’s laboratory section, I sought to combine the two predictions into a single method. While I personally align with Nate Silver’s stance that polls matter more than fundamentals as the election nears, I elected to only calculate a simple average.5
This relatively unsophisticated method of combining predictions yielded results of approximately 51.0% of the overall popular vote for Biden and 45.2% of the overall popular vote for Trump.
A Note on Forecasters’ Different Approaches
The models presented on this blog draw inspiration from but pale in comparison to forecasts from FiveThirtyEight and The Economist.
Both forecasts incorporate a mixture of polling and fundamentals in their models, with The Economist relying more heavily on fundamentals and FiveThirtyEight focusing more attention to polls, especially as the election nears. Nate Silver of FiveThirtyEight justifies this approach in stating that the small sample size of overall elections makes economic models challenging. Not only that, but he also cites the noisy relationship between economic conditions and the incumbent’s party performance as a cause for caution. On the contrary, The Economist takes a more fundamentals-forward approach and aims to combat overfitting and other issues through elastic net regularization and leave-one-out cross-validation.
In addition to balancing between fundamentals and polls, both models also adjust for state partisan lean, run thousands of simulations to anticipate possible outcomes, adjust polling and economic numbers, and attempt to account for uncertainty. FiveThirtyEight more clearly outlines specific approaches tailored toward the unique circumstances of COVID-19. However, this is The Economist’s first ever statistical forecast of an American election, so they may have decided to not include a section since they are not deviating from any precedent they set in the past.
FiveThirtyEight has more historical experience in forecasting elections, and I feel that it has a better approach for forecasting the 2020 election. On top of the thoroughly explained COVID-19 adjustments to their model, the lower dependence on economic indicators and increasing focus on the polls seems fitting for the unusual economic circumstances of 2020.
-
[Gelman and King, 1993] Gelman, A. and King, G. (1993).Why are American presidential election campaign polls so variable when votes are so predictable? British Journal of Political Science, 23(4):409–451. ↩
-
To get the values on the x-axis, I calculated the average poll numbers for each candidate from each pollster in September of 2016. Then, I subtracted the poll numbers from the popular vote share for each candidate. After that, I took the absolute value of each of these differences and summed them for each poll. Smaller sums indicate that a pollster’s September 2016 numbers were closer to the election outcome, whereas larger numbers represent polls less indicative of the future election results. ↩
-
In my approach weigh polls proportionately to their accuracy in predicting the 2016 election, I first summed the absolute value of errors for all off of the polls and then calculated each poll’s proportion of that error. Polls with smaller proportions more closely resembled with 2016 outcome. In order to ascribe greater weight to more accurate polls, I took the inverse of each proportion and then divided by 296.8874 so that the weights would sum to 1. ↩
-
These numbers only account for just under 94% of voters, which parallels relatively well to the 94% of voters to contributed to the 2016 vote shares of 48% and 46% for Hillary Clinton and Donald Trump, respectively. So, while it seems realistic that the remaining 6% of voters will vote for third-party candidates, more voters could possibly stumble upon their “enlightened preferences”1 as the election nears and the sum of the popular vote share from the two major parties will get closer to 100%. ↩
-
The reason for this is that I feel the fundamentals model fit from historical data is more statistically sound, while the polls-only prediction was only based off of 2016 numbers. If the fundamentals model and the polling prediction were both drawn from historical data, I would have assigned greater weight to the polls. Also, linear model did include a term with for polling numbers, so polls are accounted for in both standalone predictions–they just are not the sole focus of the first. ↩