2020 Presidential Election Analysis
Kayla Manning, Harvard College
Shocks and Elections: COVID-19
October 24, 2020
What the Literature Says about Shocks
Previous research claims that shark attacks1 led to Woodrow Wilson’s defeat in the 1916 election, but follow-up studies revealed flawed methodology behind the sensational claim.2 Voter behavior punishing incumbents for natural events seems irrational; however, voters can reasonably fault the incumbent for certain results of such events. For example, research reveals that voters punish incumbents for economic damage resulting from tornadoes3 but not death counts. In the case of tornadoes, the president has the power to minimize economic damage by issuing a disaster declaration. This study on tornadoes supports the notion that voters react to how the incumbent handles natural disasters rather than blaming the president for the occurrence of the disaster.
In the face of numerous other scandals ranging from tax avoidance by the president, misleading the public on the state of COVID-19, and accusations of suspicious emails, the disaster of COVID remains the defining issue of 2020. How will the shock of COVID-19 translate into electoral outcomes? To answer this question, we must consider how voters believe Donald Trump handled the COVID pandemic.
The Impact of COVID-19 on the 2020 Election
The economic numbers of 2020 undoubtedly reflect the damage of COVID; incorporating economic data into predictions helps to account for some of the pandemic-related fallout. However, voters may also feel that he mishandled less concrete aspects of the pandemic, such as his hesitancy to wear a mask or his COVID-19 diagnosis late in the campaign.
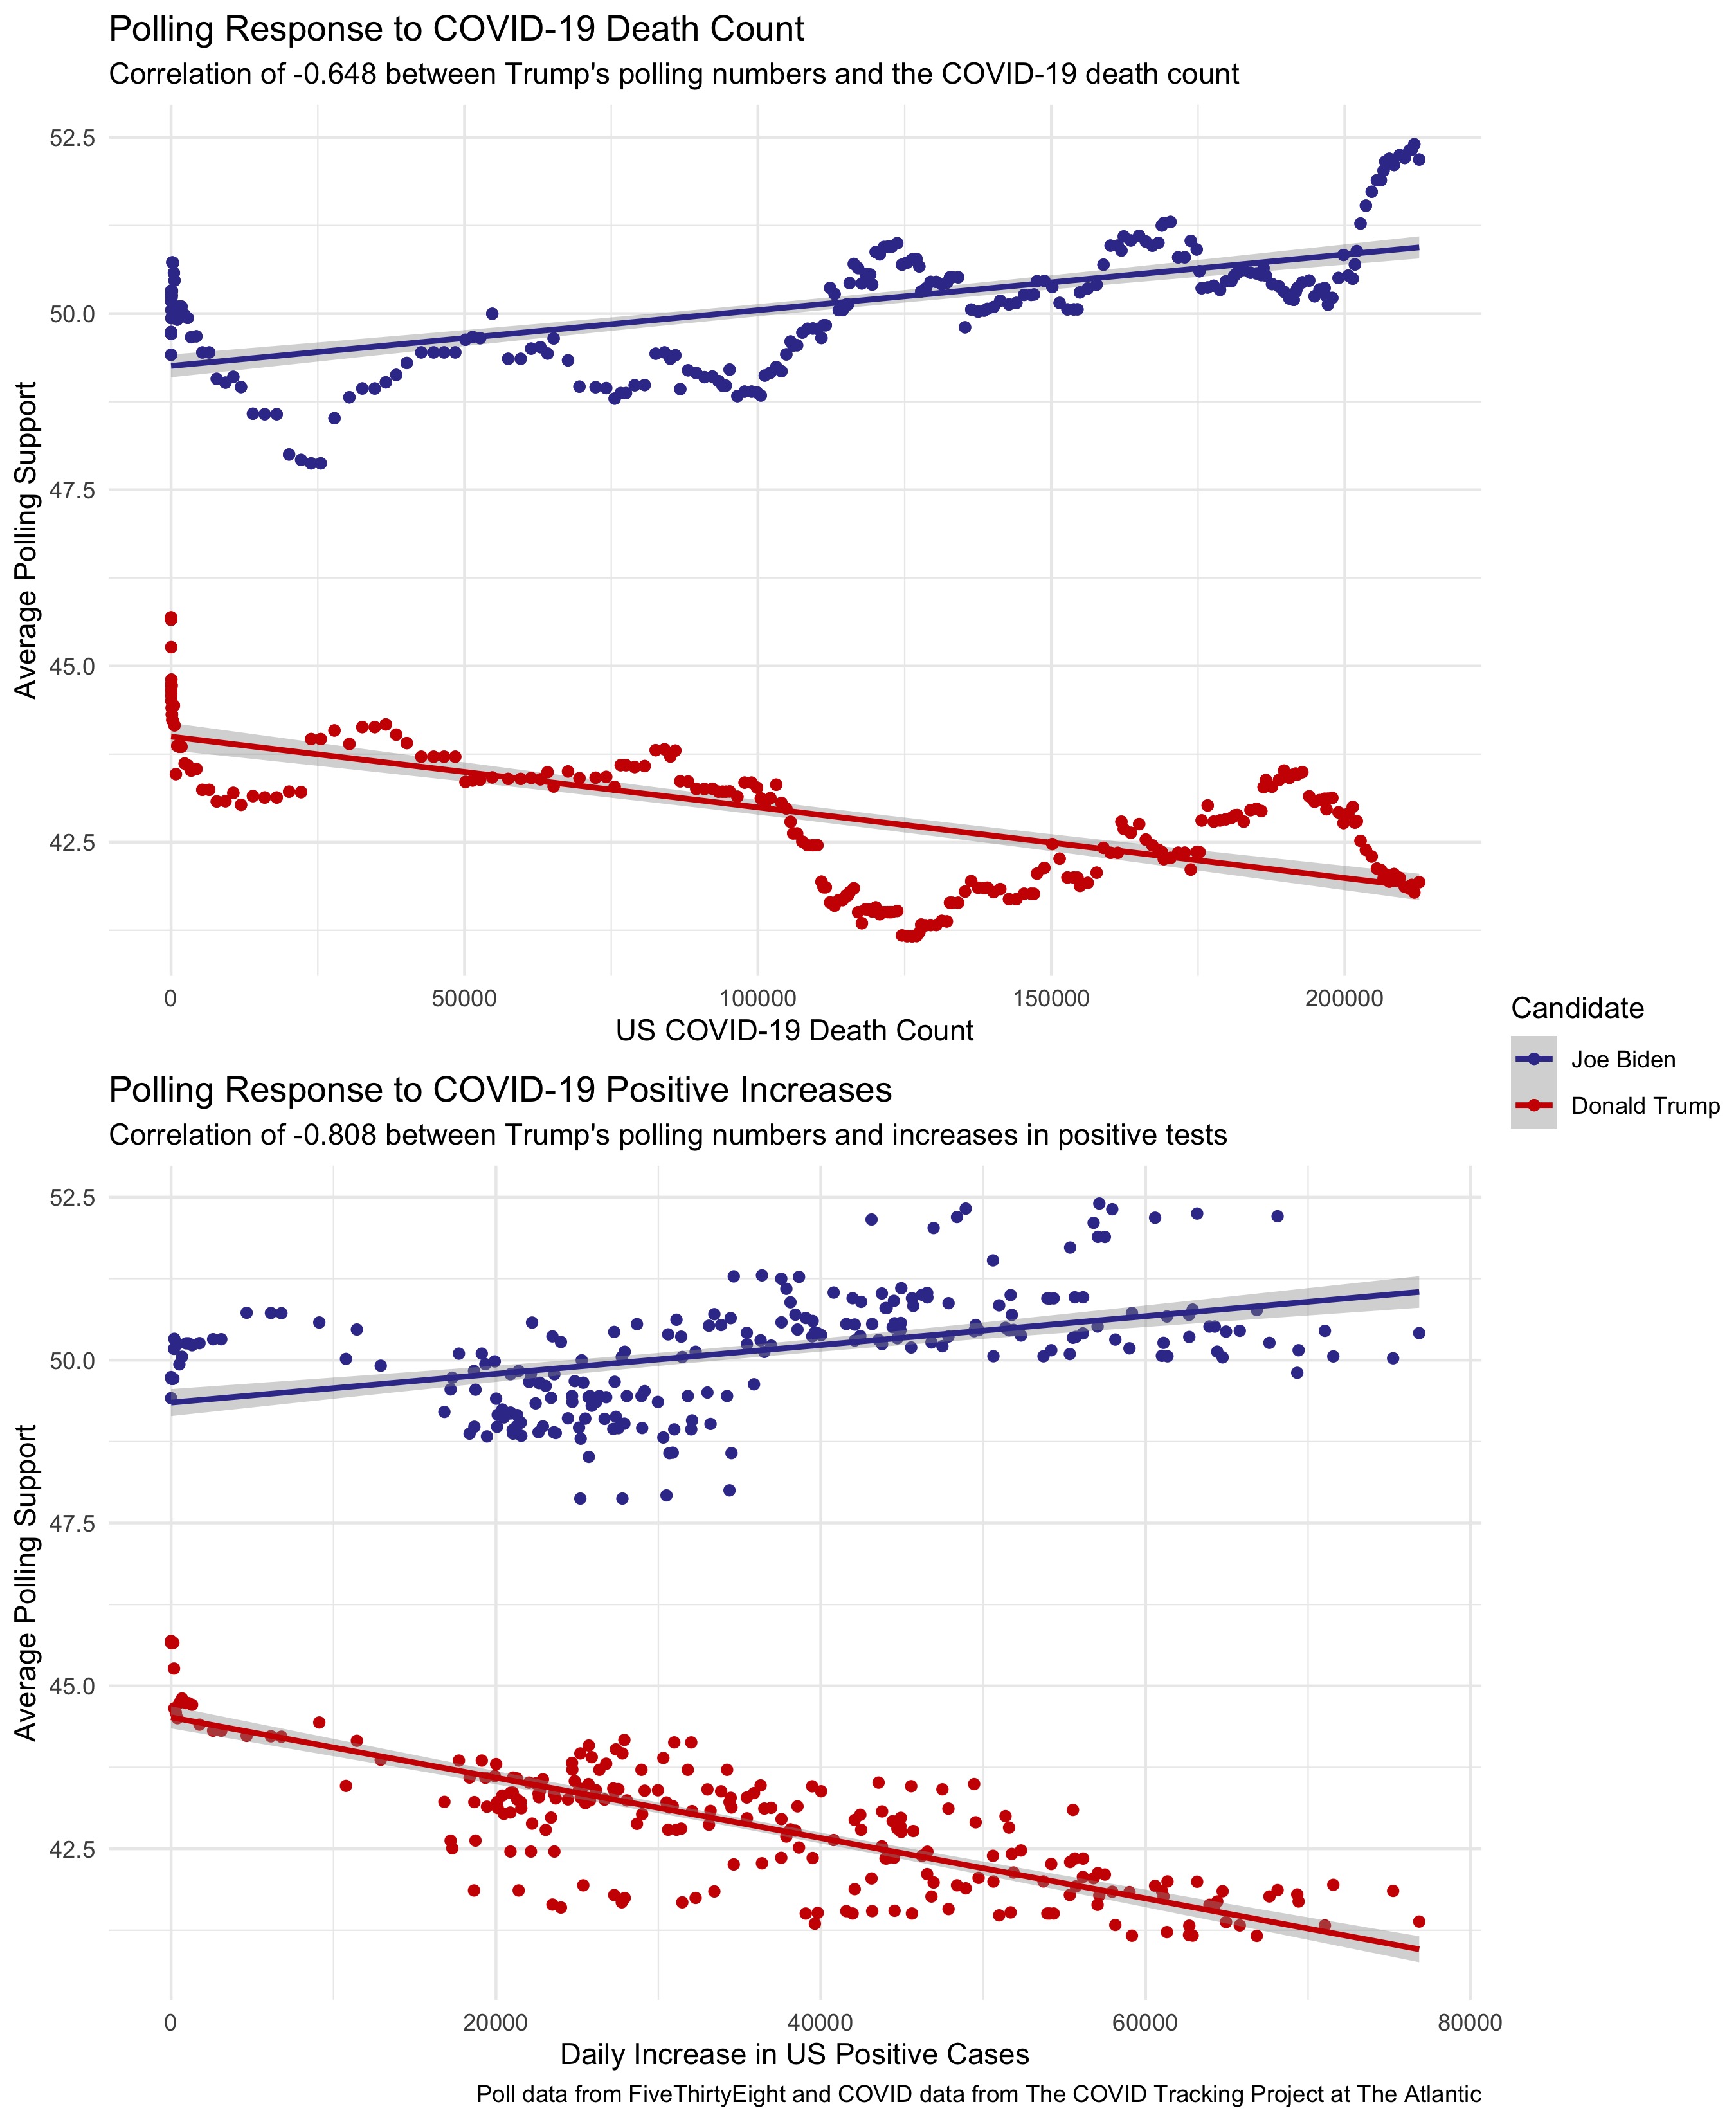
Voters’ emotional responses to events may exist independent of economic circumstances. In theory, polls should capture voters’ responses to shocks, including the pandemic. Examining COVID-19 metrics shows that the increasing COVID death counts and positive test results have fairly strong, negative correlations with Donald Trump’s approval ratings:4
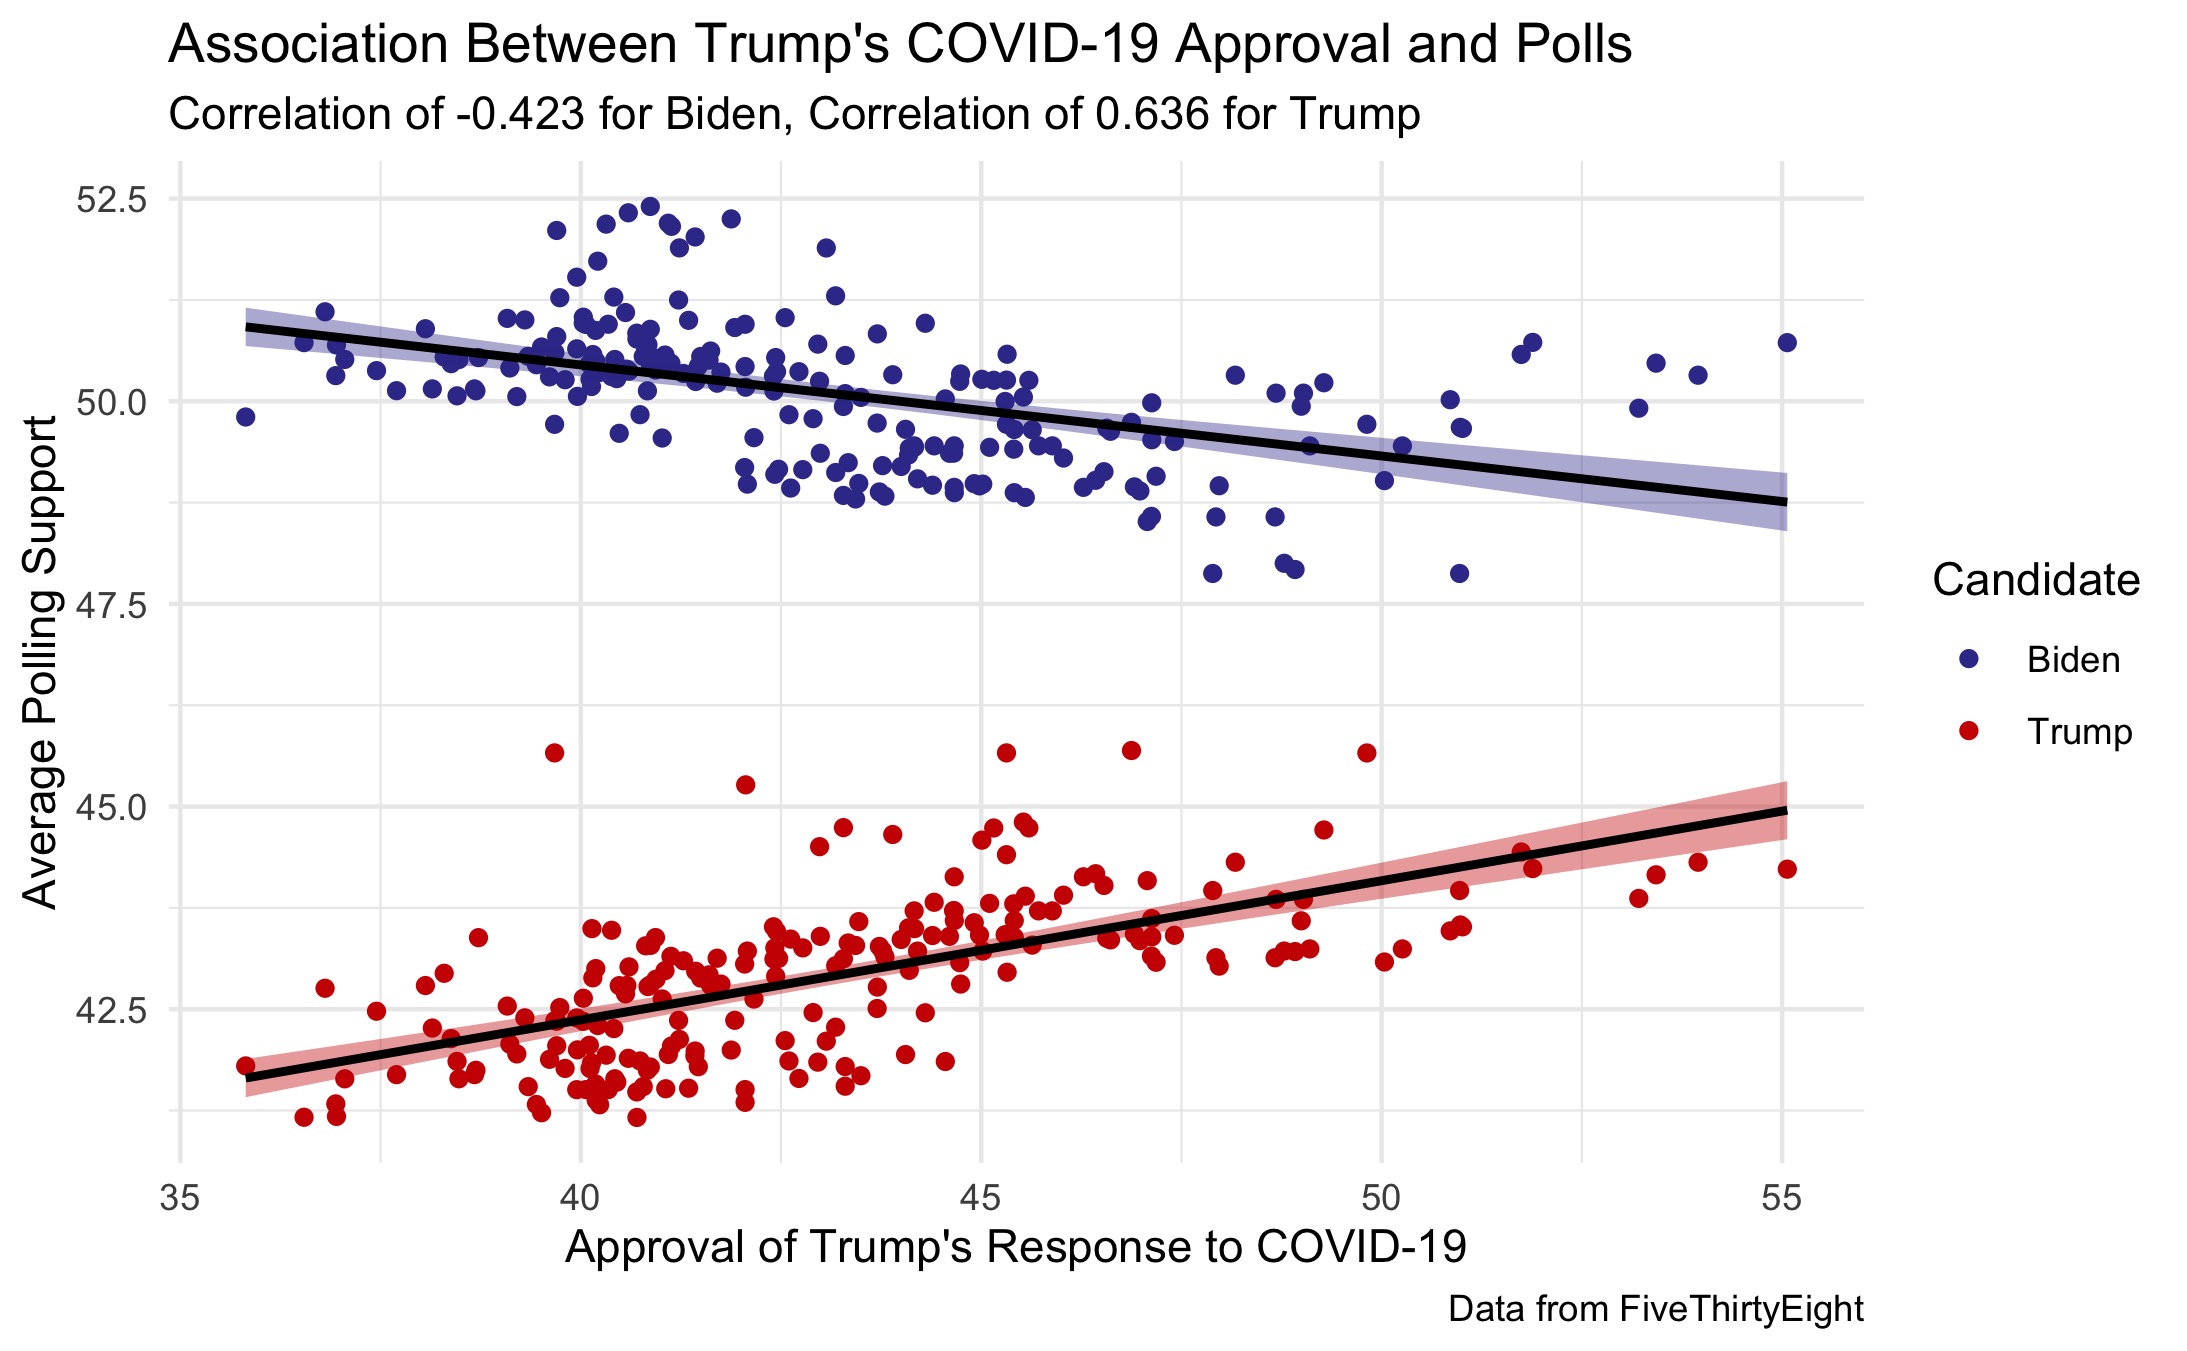
Not surprisingly, public opinion regarding Donald Trump’s handling of the COVID-19 crisis has a moderately strong, positive correlation with his overall polling numbers, and Biden’s poll numbers have a negative correlation with Trump’s COVID approval:
Since COVID metrics and COVID-specific approval are correlated with variables already included in my models, I will avoid redundancy by using polls and economic metrics as proxies for the impact of COVID.
Modeling with Economic Numbers and Polls, by State
A few modifications to last week’s model led to much more reasonable predictions. As I mentioned in the previous post, fitting a separate model for each state left each model extremely susceptible to overfitting and poor out-of-sample performance. To fix this, I made the following changes:
-
I fit separate models for 3 different categories of states–likely blue states, likely red states, and battleground states5–with the thinking that voters within groups of states exhibit similar behavior in elections. This method uses each state in every election as an individual observation, thereby increasing the sample size for fitting the model.
-
I omitted several predictor variables from last week’s model in an attempt to keep this model parsimonious without sacrificing precision.6 This new model predicts each state’s votes using state polling numbers from 2 weeks out, the candidate’s incumbency status, the interaction between incumbency and polls, national Q1 GDP growth, the previous election’s Democratic vote margin in that state, and the change in that state’s Black population since the previous election.
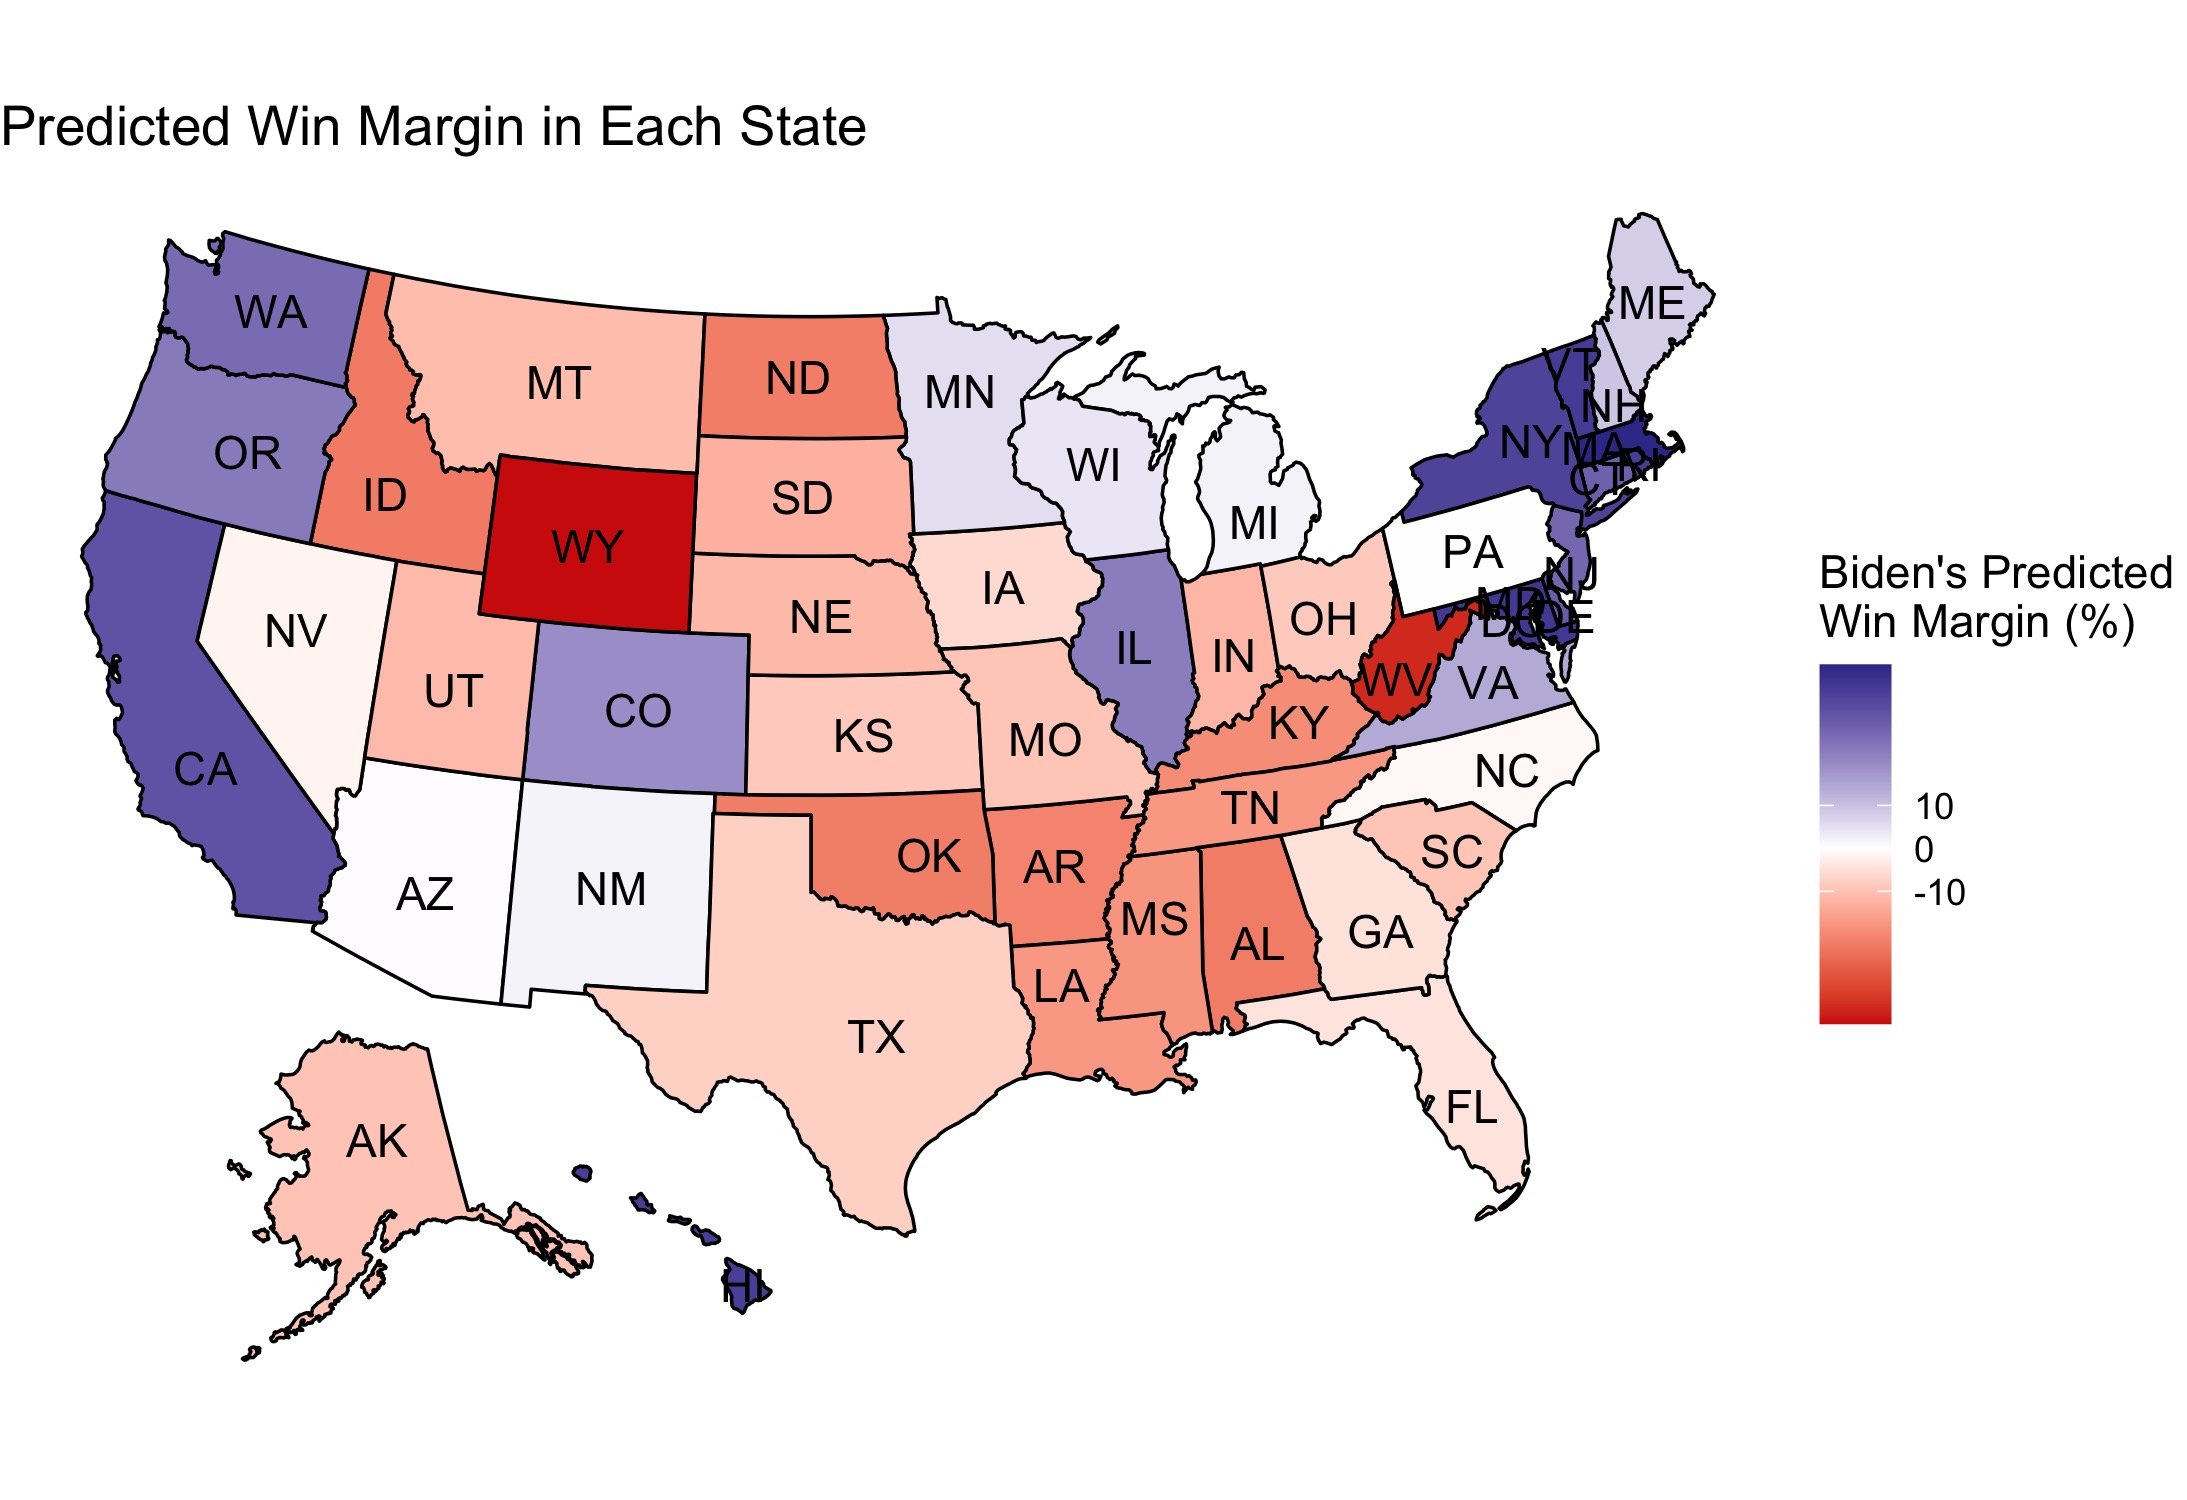
I maintained the underlying binomial logistic structure from last week, and I varied the turnout as I did before. As of the afternoon of October 26, 2020, this model forecasts an electoral count of 284 for Biden, but the model projects many close state-wide races so this prediction will likely change as Election Day approaches:
| Candidate | Electoral Votes | Two-Party Popular Vote |
|---|---|---|
| Biden | 2847 | 0.534 |
| Trump | 254 | 0.466 |
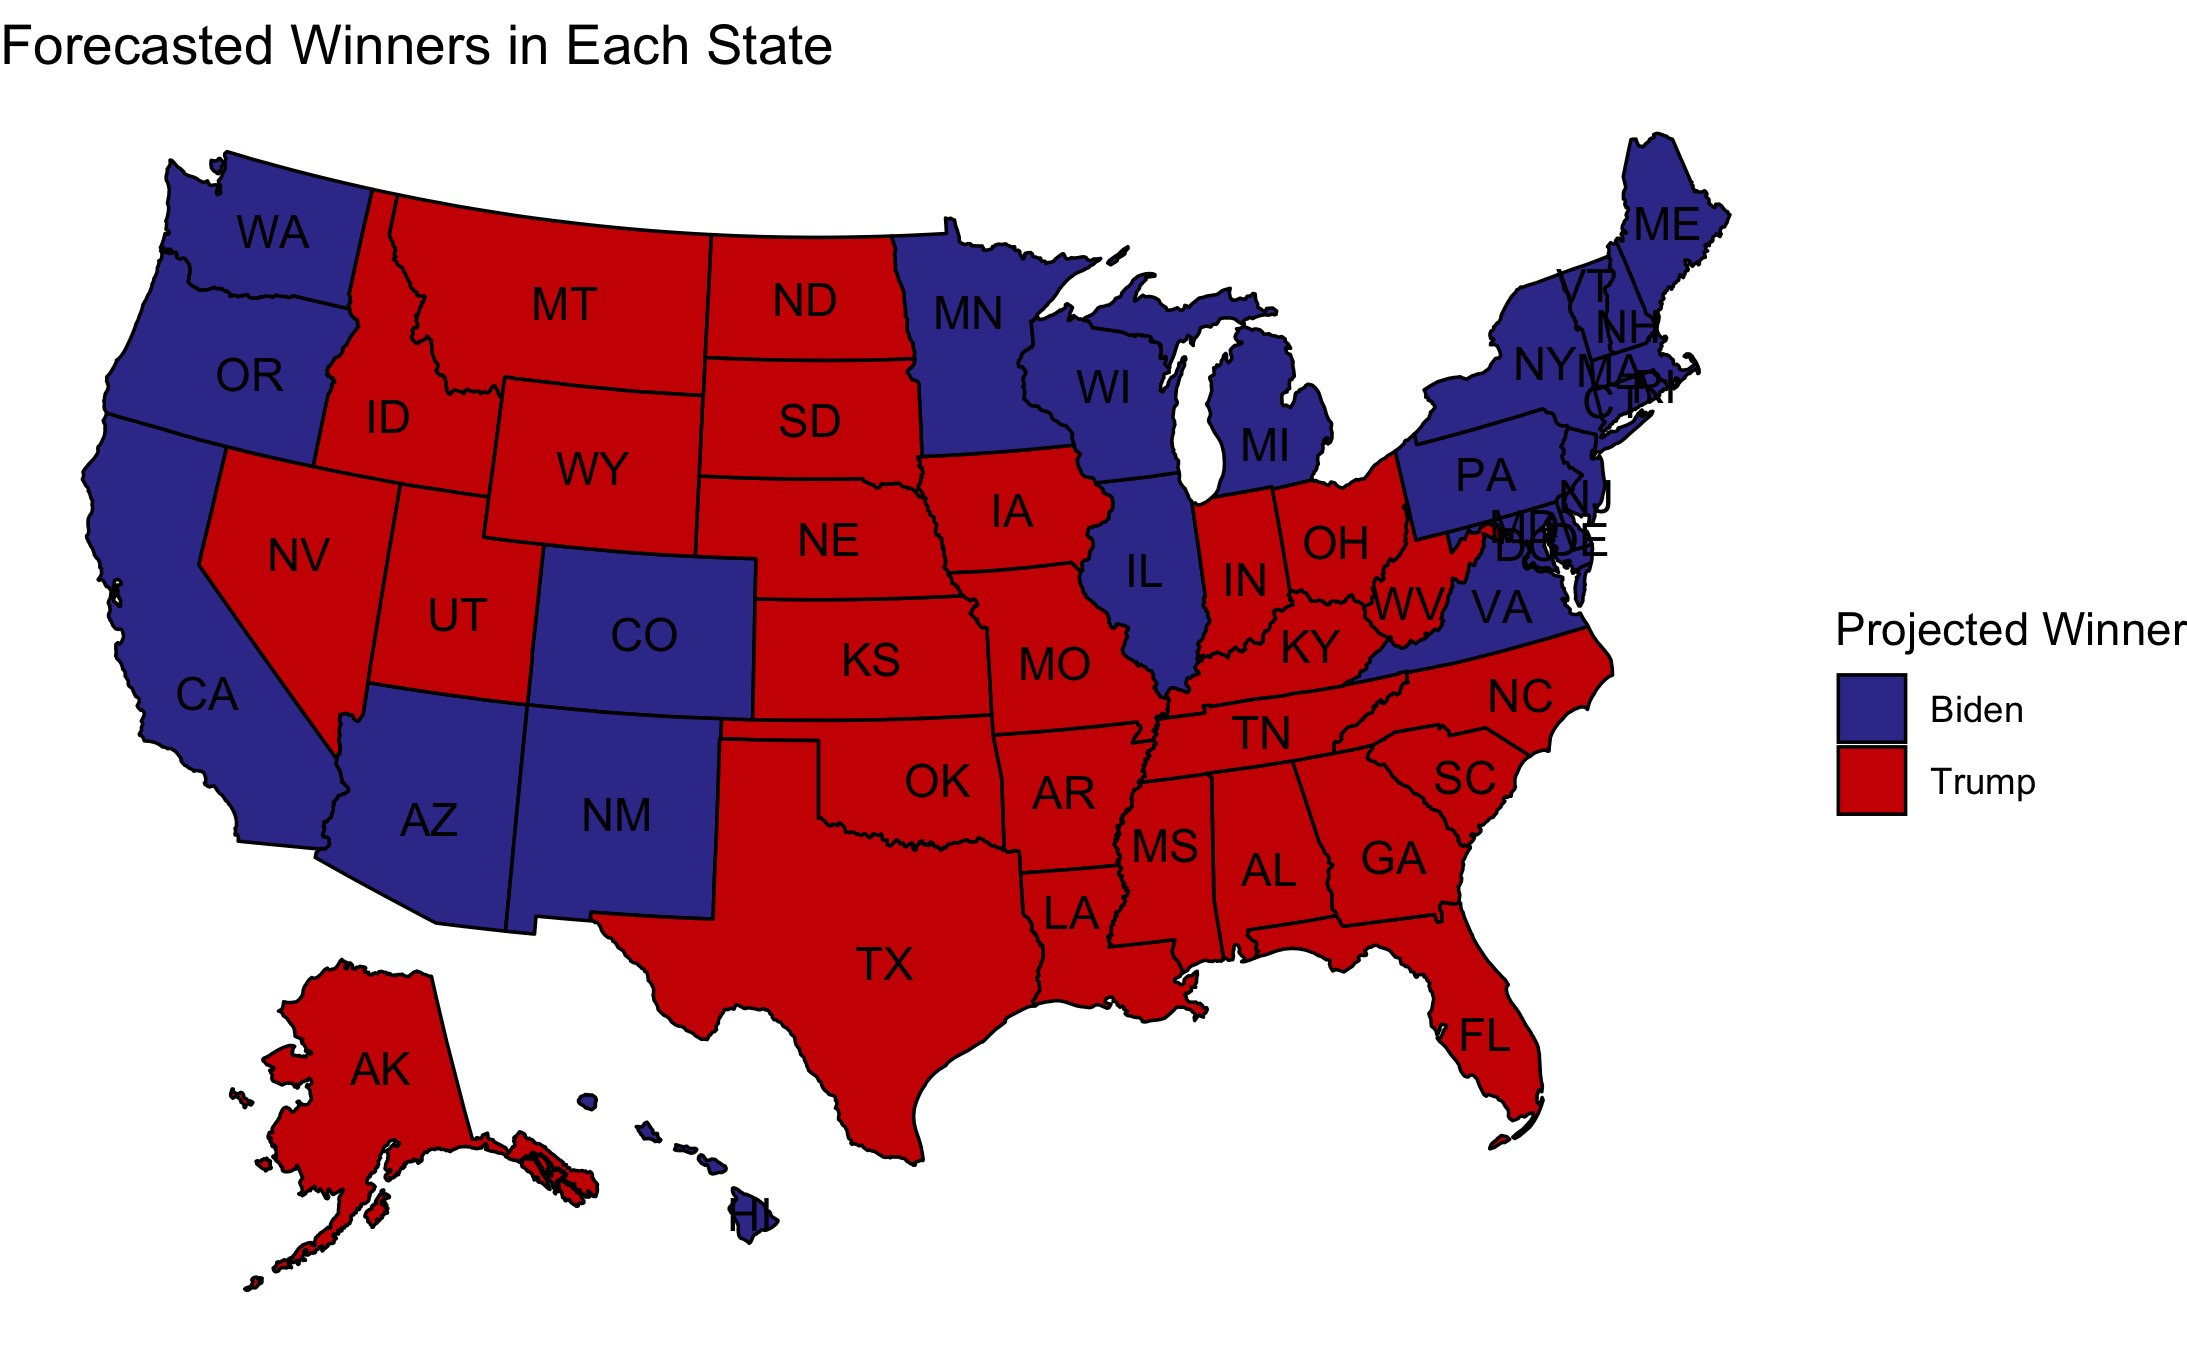
The above map displays the closeness of the race in each state. For a better look at predicted state-by-state outcomes, this map displays the predicted winner for each state without regard to closeness and this table lists the predicted two-party popular vote shares for each state.
Looking Ahead
With less than two weeks remaining until Election Day, the next blog post will contain a final election prediction. This post uses my model as part of the discussion about how the polling numbers and economic data fit into COVID-19. However, my final prediction will include updated polling numbers and go into further depth about the reasoning behind the model, the forecast’s strength and external validity, and uncertainty surrounding the prediction.
-
[Achen and Bartels, 2017] Achen, C. H. and Bartels, L. M. (2017). Democracy for realists: Why elections do not produce responsive government, volume 4. Princeton University ↩
-
[Fowler and Hall, 2018] Fowler, A. and Hall, A. B. (2018). Do Shark Attacks Influence Presidential Elections? Reassessing a Prominent Finding on Voter Competence. The Journal of Politics, 80(4):1423–1437. ↩
-
[Healy et al., 2010] Healy, A., Malhotra, N., et al. (2010). Random events, economic losses, and retrospective voting: Implications for democratic competence.Quarterly Journal of Political Science, 5(2):193–208. ↩
-
It is important to note that the plot of death counts shows the total count of deaths in the United States, which will never decrease as time goes on. Plotting the number of deaths on the x-axis is essentially equivalent to showing time passing over the course of the pandemic. Even if COVID-19 was much worse in March than August, August would have a much higher death count than March by the nature of the data. In contrast, the increase in the number of positive tests may vary greatly each day with similar counts possible months apart. The strong negative correlation between the increase in positive test results and Trump’s poll numbers shows that the polls are associated with the increase in positive results, which serve as a proxy for the severity of the pandemic, rather than serving as a simple function of time. ↩
-
I followed the New York Time’s classification of states when selecting which states to include in each model. ↩
-
I removed correlated variables from the model and kept predictors that assessed the fundamentals, polls, previous outcomes, and demographics. ↩
-
The model did not include DC, but I added it to the electoral count since it consistently votes blue in presidential elections. ↩